Support and resistance are fundamental concepts of technical analysis in forex trading. The core idea is to identify price areas where market might reverse. Individuals who just began their trading journey would most likely base their trading decisions on these horizontal lines on the chart.
As we dive into the topic of support and resistance, here’s a look at how it might look like when featured in a chart.
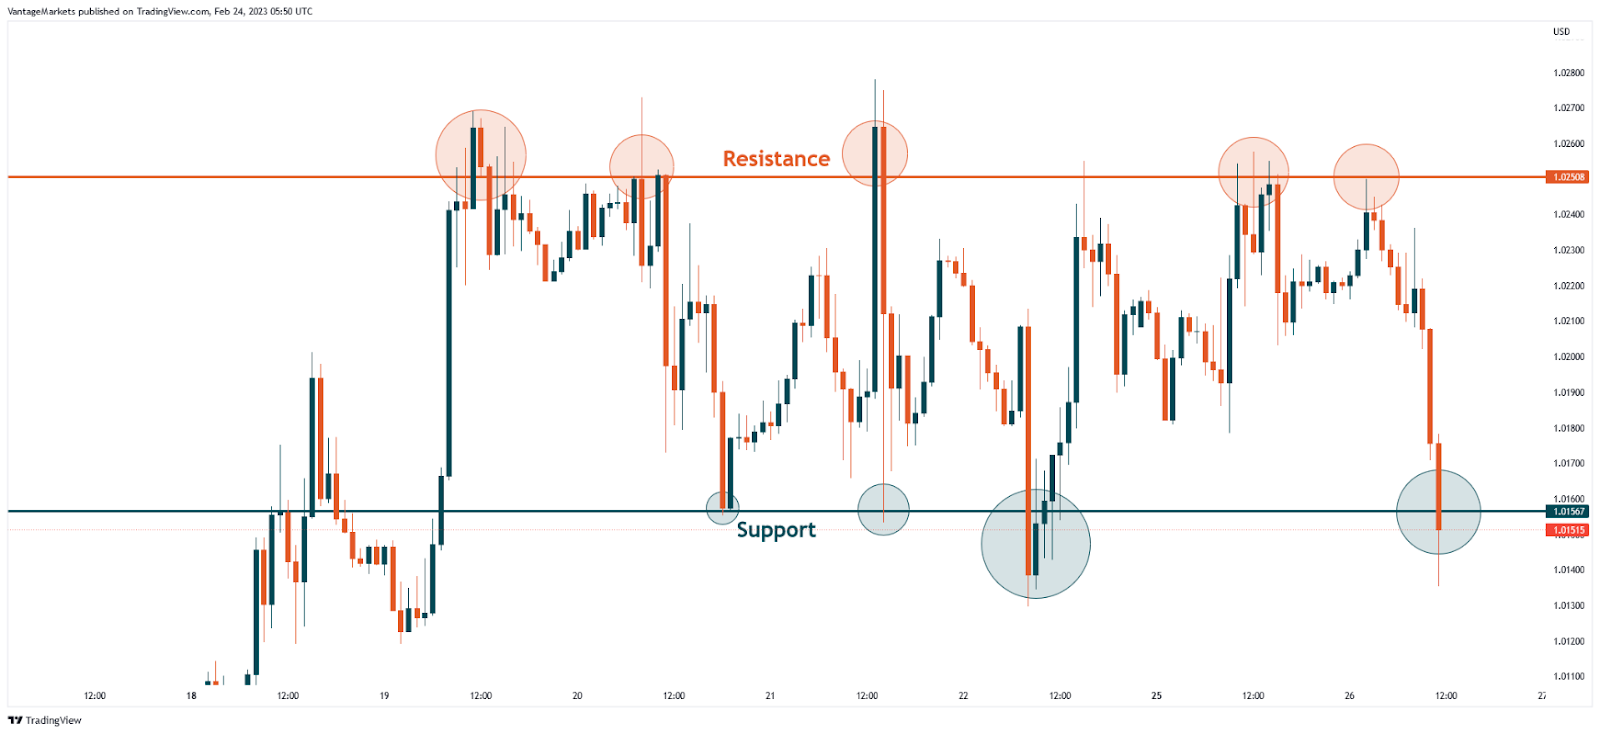
Figure 1 – General Idea of Support & Resistance (https://www.tradingview.com/x/bjVDzkAv/)
Key Points
- Support and resistance are pivotal levels on price charts where the market often reverses or stalls: support indicates a price level where a downward trend is likely to pause due to a concentration of demand, while resistance is where an upward trend may halt due to a concentration of supply.
- The credibility of a support or resistance level is established by how often it is tested and held firm.
- Traders typically buy at support and sell at resistance, but these levels can break under market
pressure, at which point former support may turn into resistance and vice versa; dynamic support and resistance are adaptive levels shown by moving averages, indicating potential price rejection areas.
What is Support?
Support is a price level where the market tends to reverse from a bearish move. The more times a support is verified, the more credibility it has.
How Do You Determine A Support Level?
A support level can be easily recognised as a price point that markets cannot seem to break lower. Whenever a market approaches a support level, prices would most likely reverse bullish. The more times a support level is tested, the more credibility it has.
For example, EURUSD is on a bearish trend, but markets can’t seem to break below the price point of 1.20000, it can be said that there is a support area near the price point of 1.20000.
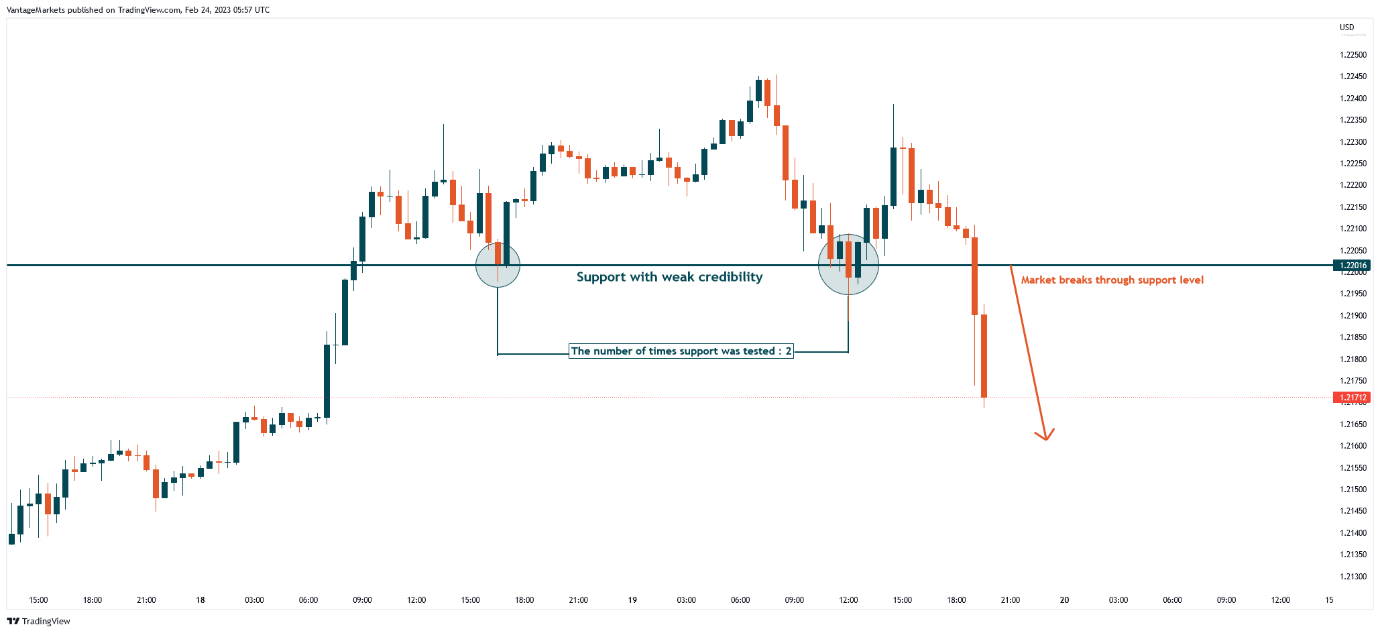
Figure 2 – EURUSD M30 Weak Support (https://www.tradingview.com/x/nS3U7SUv/)

Figure 3 – EURUSD H4 Credible Support (https://www.tradingview.com/x/Uy6p252d/)
What is Resistance?
Resistance is the opposite of support. It is a price level where the market tends to reverse from a bullish move. The more times a resistance is verified, the more credibility it has.
How Do You Determine A Resistance Level?
A resistance level can be easily recognised as a price point that markets cannot seem to break higher. Whenever a market approaches a resistance level, prices would most likely reverse bearish. The more times a resistance level is tested, the more credibility it has.
For example, GBPUSD is on a bullish trend, but markets are unable to break above the price point of 1.2300, it can be said that there is area of resistance near the price point of 1.2300.
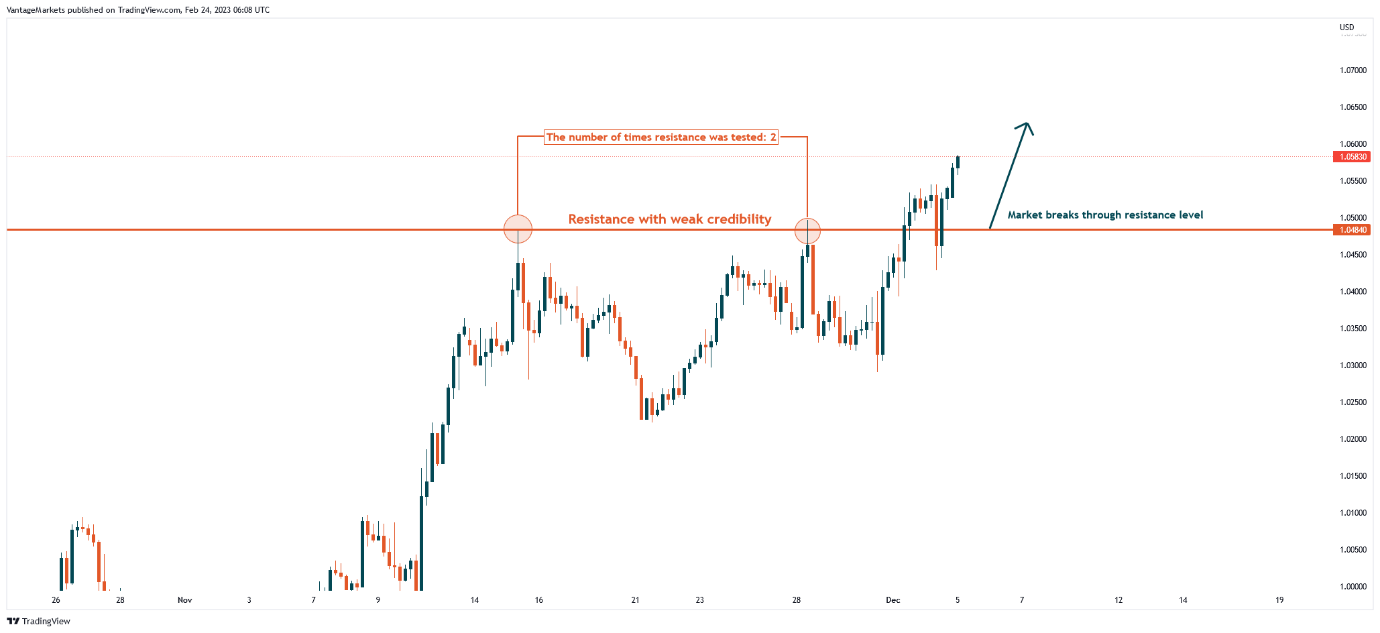
Figure 4 – EURUSD H4 Weak Resistance (https://www.tradingview.com/x/CURVzxXA/)
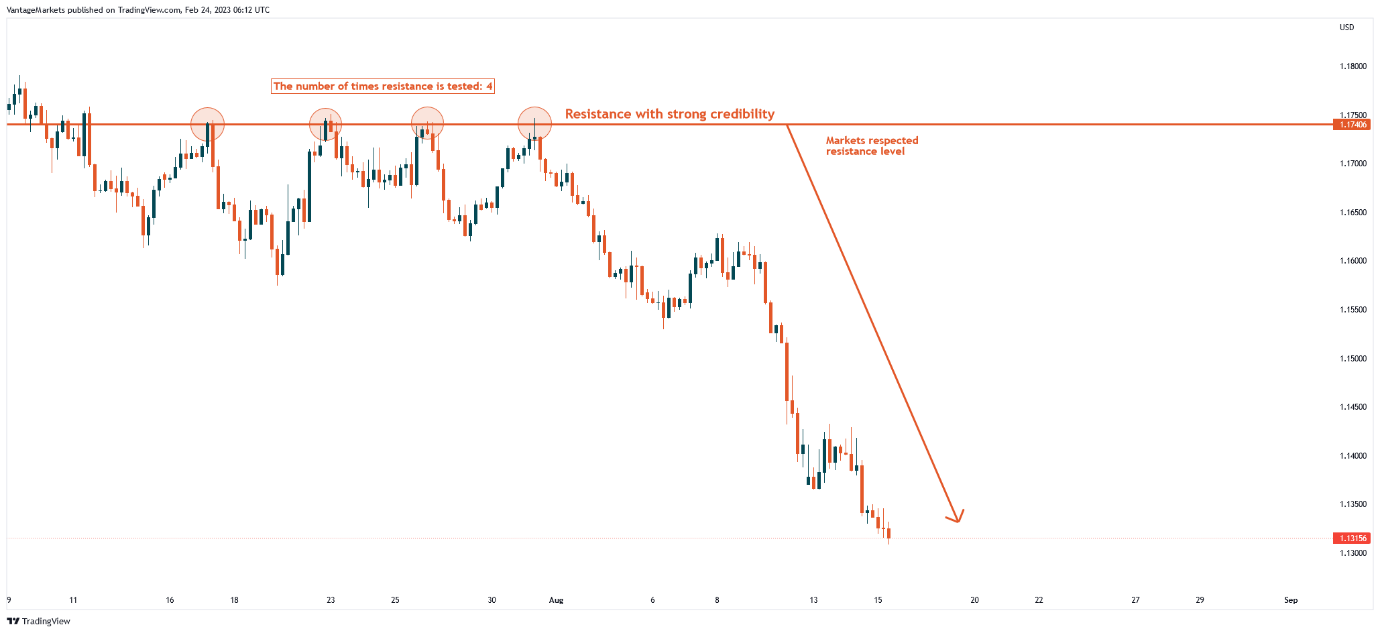
Figure 5 – EURUSD H4 Credible Resistance (https://www.tradingview.com/x/ayA61eBk/)
How to Trade Support & Resistance?
The rule of thumb is to “buy at support, sell at resistance.” This means that in a bullish market, when markets reach a support level with credibility, a buy trade may be executed. While the reverse is also true, when markets reach a credible resistance level, a sell trade may be executed.
Traders can use support and resistance levels to determine potential entry and exit points for their trades. Figure 6 shows an example of buying at support in EURUSD, while Figure 7 shows an example of selling at resistance in EURUSD.
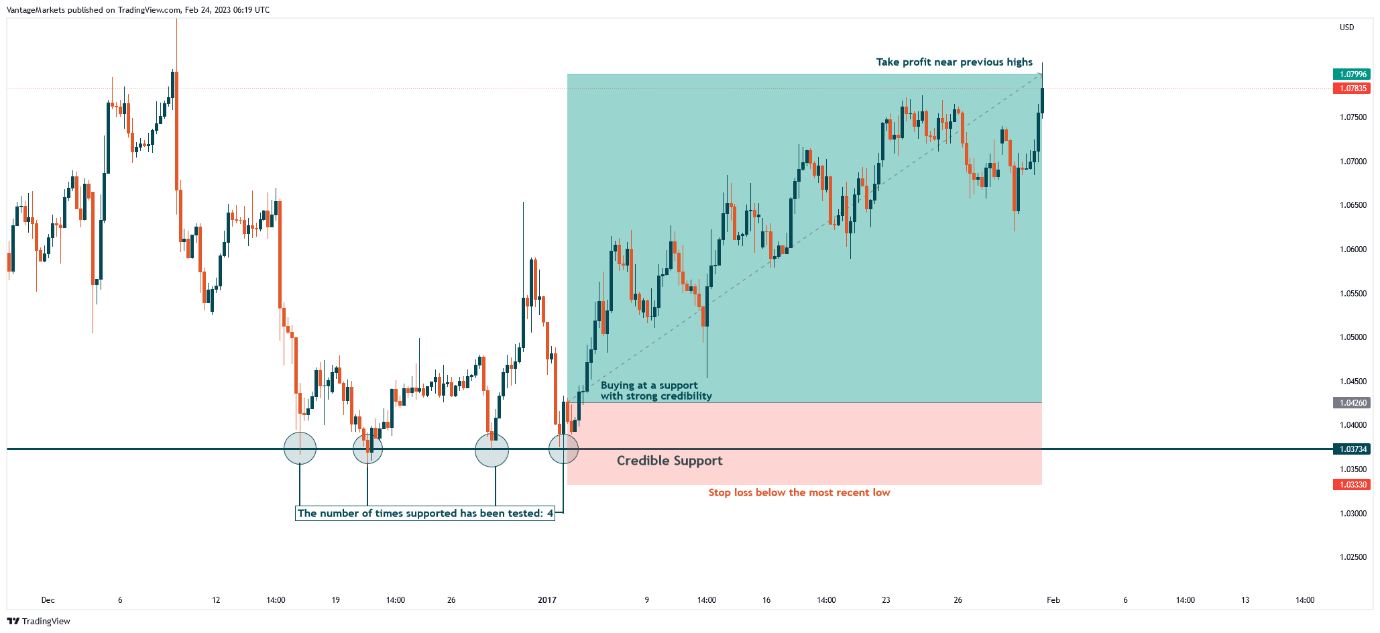
Figure 6 – EURUSD H4 Support Buy Trade Example (https://www.tradingview.com/x/9ITkfX92/)
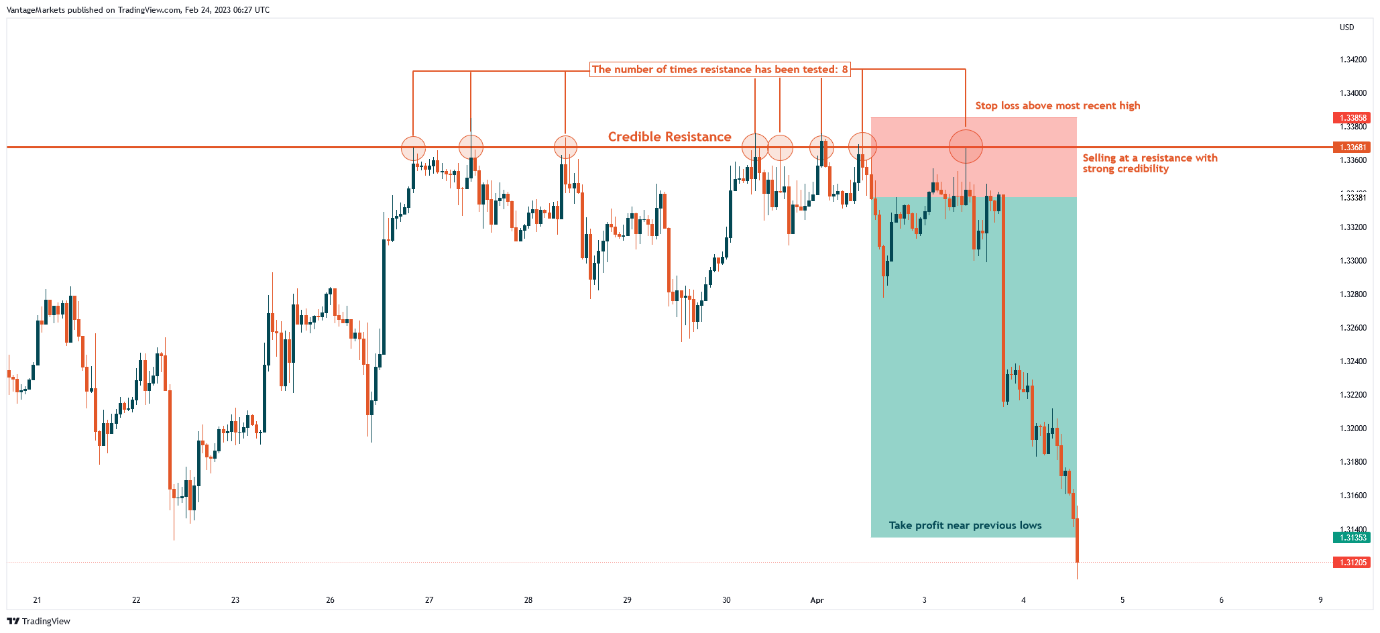
Figure 7 – EURUSD H1 Resistance Sell Trade Example (https://www.tradingview.com/x/2ypMehaZ/)
A Break in Support or Resistance
Support and resistance areas are not always observed by the market. There will be occasions when even with a presumably credible support, markets could go further bearish, leading to a break in support level.
However, even with credible support or resistance levels being broken, other trade opportunities may occur. When a support level is broken, the same support can be used as a resistance level, and if a resistance level is broken, the same resistance level then becomes a support level.
Figures 8 demonstrates how a broken support level turns into a resistance level.
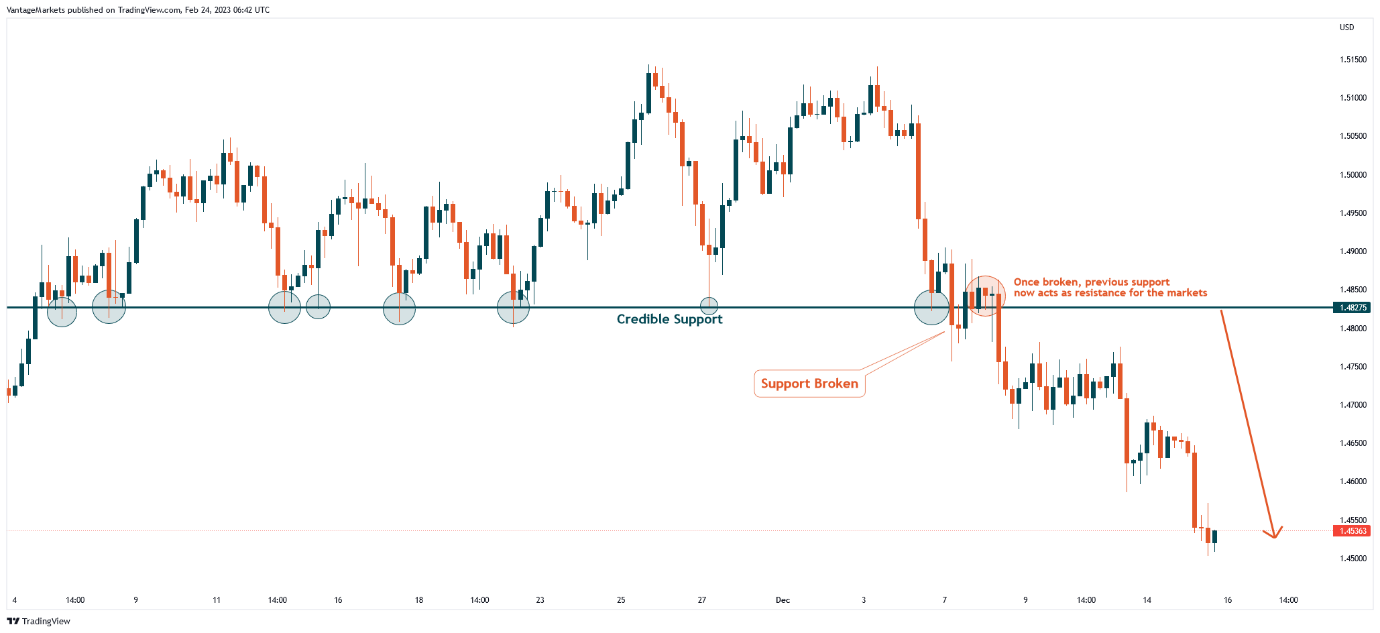
Figure 8 – EURUSD H4 Broken Support Turned Resistance (https://www.tradingview.com/x/7Imcja90/)
Figure 9 demonstrates how a broken resistance level turns into a support level.
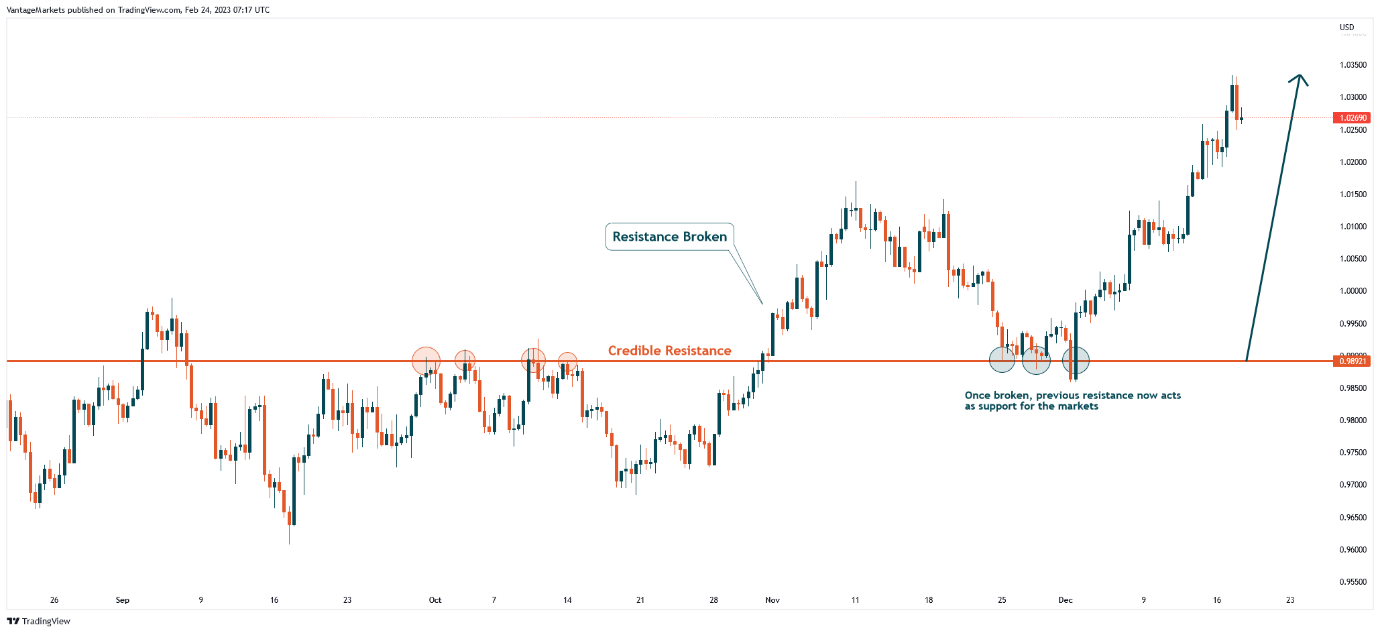
Figure 9 – EURUSD H8 Broken Resistance Turned Support (https://www.tradingview.com/x/jDYXiaTa/)
Dynamic Support and Resistance
Dynamic support and resistance come in the form of adaptive moving averages that show areas of rejection in the financial markets.
Figure 10 shows an example of dynamic resistance using a 100-period moving average in EURUSD. When the market approaches the moving average, it tends to repel from it, serving the same purpose as a horizontal resistance level. Figure 11 demonstrates the same concept but as dynamic support.
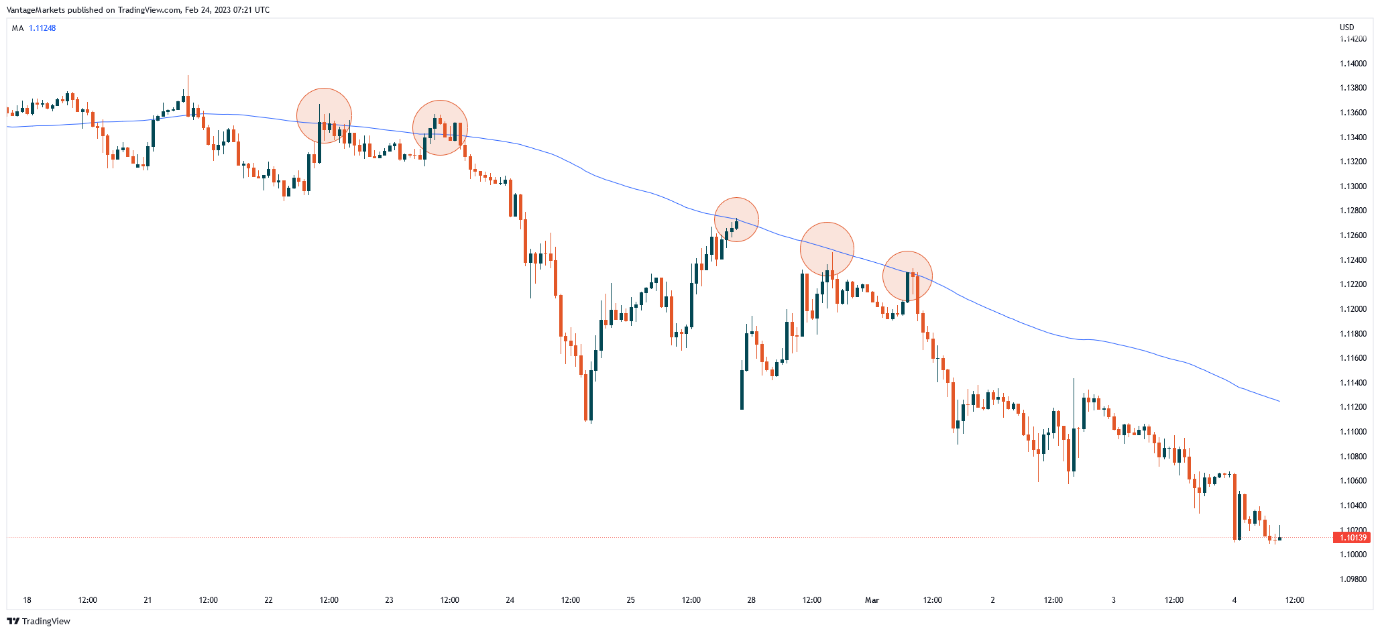
Figure 10 – EURUSD H1 100-Period Moving Average Dynamic Resistance(https://www.tradingview.com/x/gQtQshLD/)
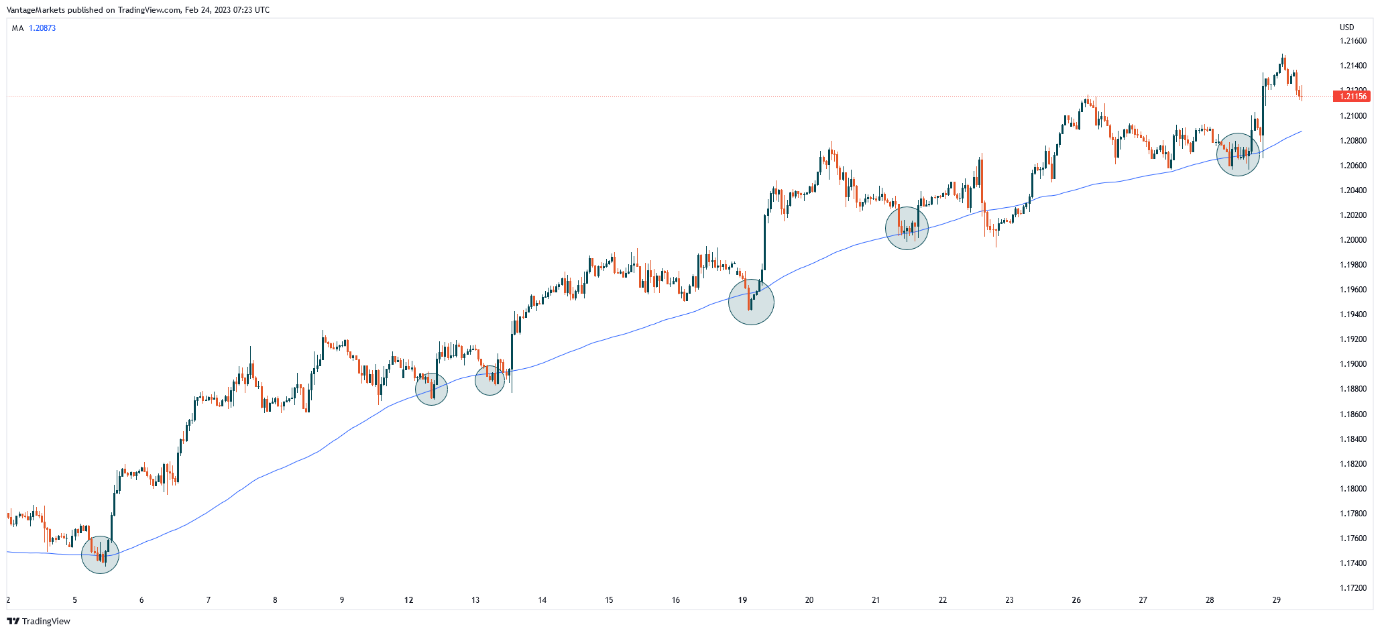
Figure 11 – EURUSD H1 100-Period Moving Average Dynamic Support (https://www.tradingview.com/x/1V1jSnLB/)
Conclusion
In conclusion, support and resistance are key concepts in technical analysis that traders can use as a reference to identify potential price reversals in financial markets.
It’s important to note that these levels are only indicative of a possible reversal of prices, and they by no means should be regarded as constantly reliable. To improve its success rate, traders should refer to more historical prices, continuously monitor price movements and adjust their trading strategies accordingly.Taking support and resistance trading to the next level? Check out our Complete Guide to Supply and Demand article to learn more.