What is Trend Analysis?
Trend analysis is a technical analysis technique that attempts to predict the future movement of an instrument. If one were to ask a group of traders about the trend of a certain market, there would be multiple different answers. The ambiguity of trend determination becomes a major hurdle that traders face at the start of their journey, often leading to the emotional pitfalls in trading.
To begin, it is important to understand that a trending market does not move in a straight line. Markets move in waves, forming highs and lows.
The famous saying “The trend is your friend” is especially true. Once the trend has been analysed, traders may use this technical advantage to develop a bias that can support their trading strategy.
Key Points
- Trend analysis predicts future price movements based on waves forming highs and lows, using tools like trendlines.
- Trendlines, which require at least three touches to be valid, indicate the direction of a trend, with higher highs and lows for an uptrend, and the opposite for a downtrend.
- Moving Averages act as dynamic trendlines, trendline breaks signal market dynamics changes, and counter trendlines can identify minor trends within a major one.
What are Trendlines?
One of the most basic tools in a trader’s arsenal, the humble trendline can provide much more information than one would expect. A trendline highlights the direction of an instrument is trending. As it is true that trendlines can be highly subjective, hence the goal is to dictate the most obvious one.
Basic Characteristics of a Trendline [1]
Here are the two characteristics that help to define a trendline.
1. Minimum of three touches on the trendline to be considered valid.
2. Needs to be forming higher highs and higher lows for an uptrend, lower lows and lower highs for a downtrend.
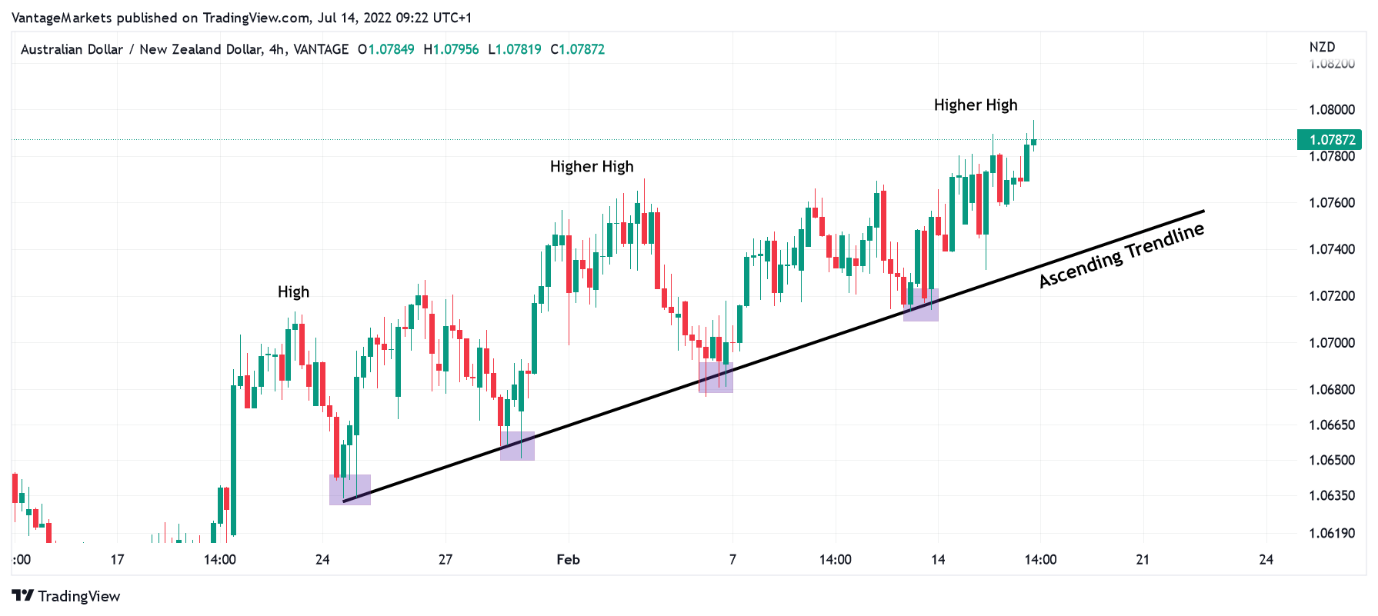
Figure 1 – AUDNZD D1 Ascending Trendline (https://www.tradingview.com/x/EoVjho5n/)
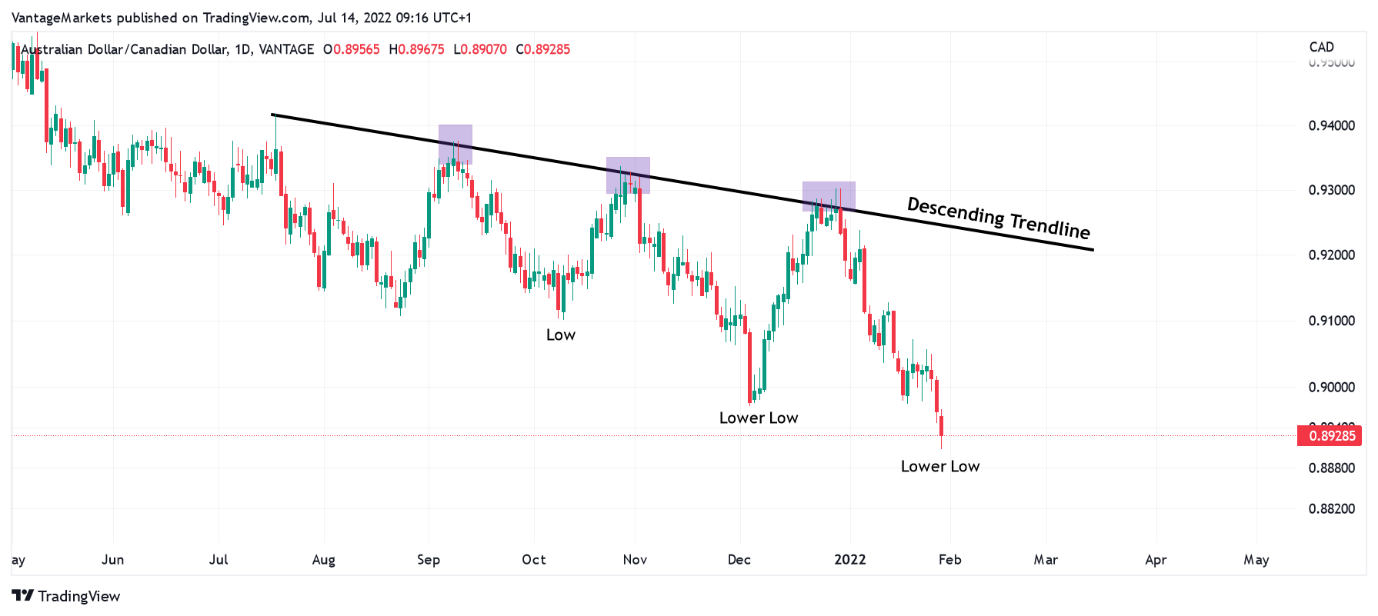
Figure 2 – AUDCAD D1 Descending Trendline (https://www.tradingview.com/x/lF0PJW22/)
Moving Average as a Dynamic Trendline
The Moving Average acts as a dynamic trendline for markets [2]. If the market is on an uptrend, markets tend to use the Moving Average as an ascending trendline while for downtrend markets, it is the reverse.
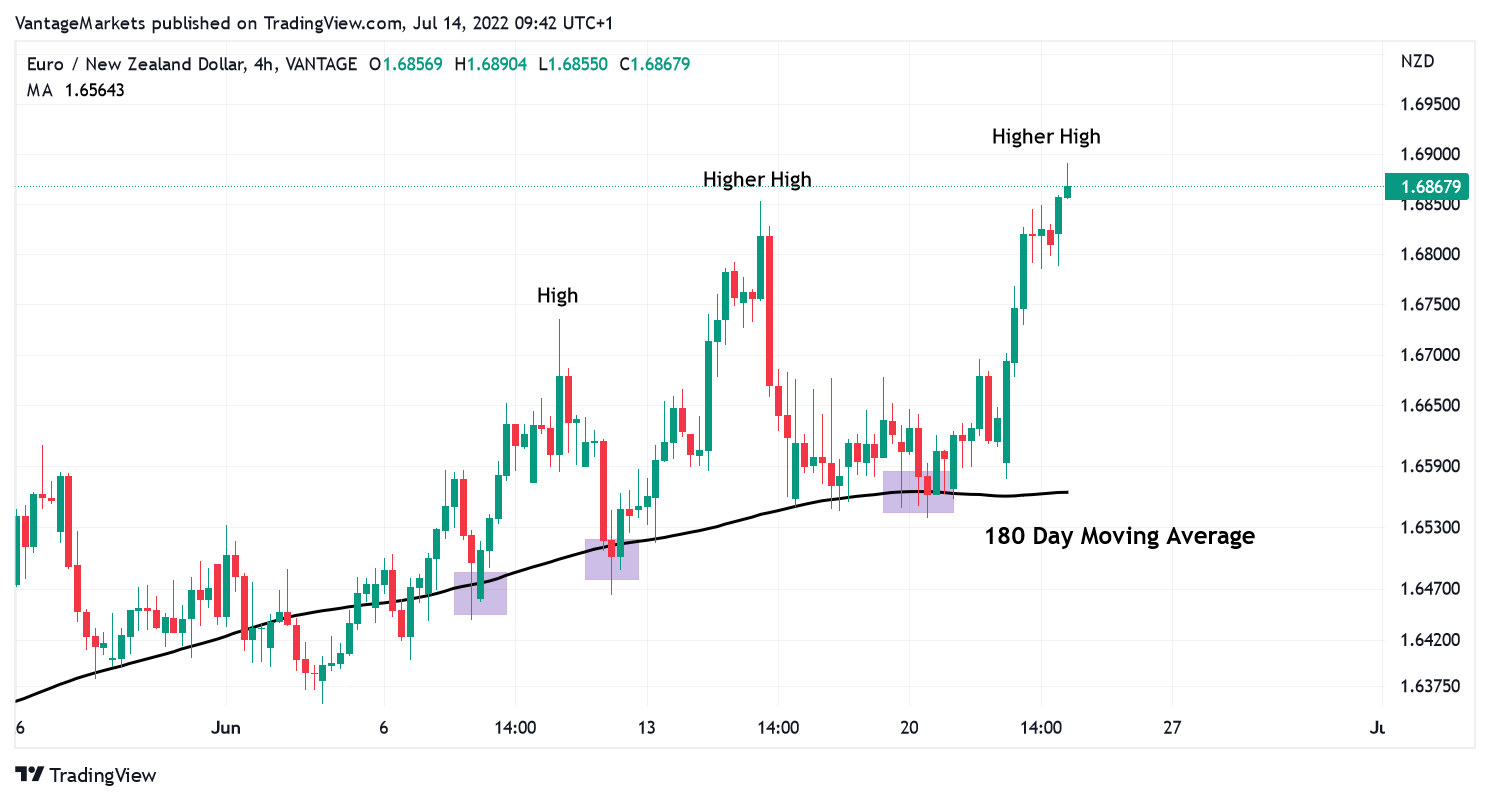
Figure 3 – EURNZD H4 180 Period Moving Average Bullish (https://www.tradingview.com/x/pZYN2iIA/)
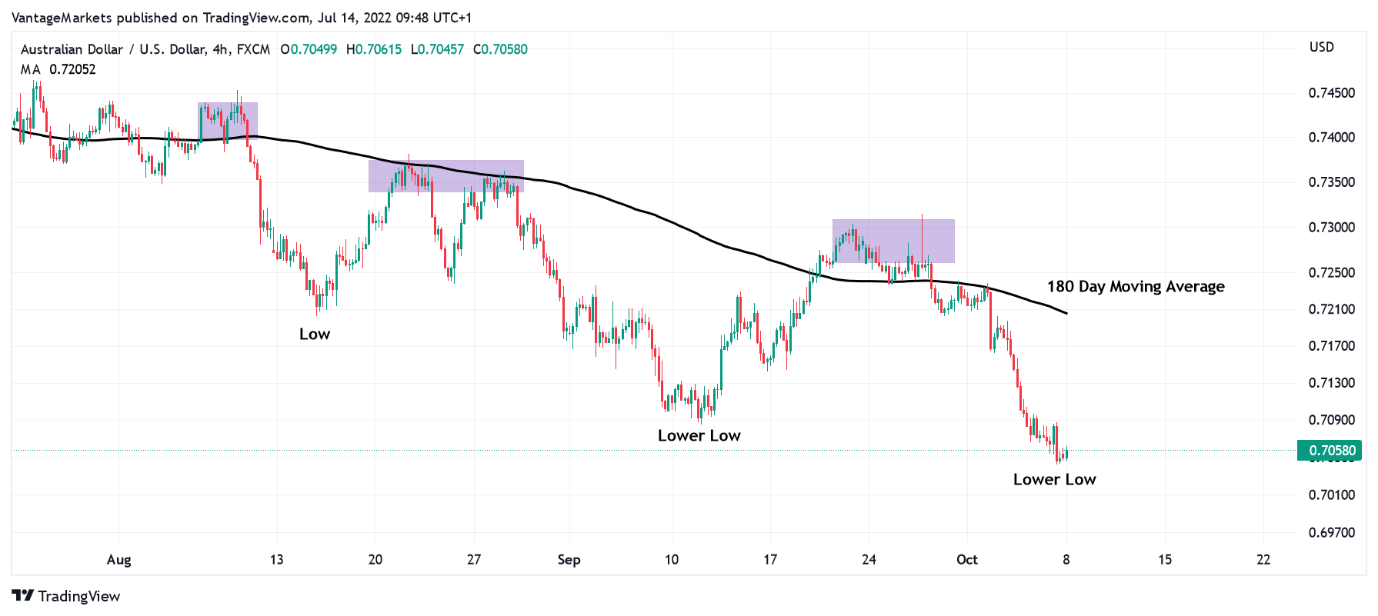
Figure 4 – AUDUSD H4 180 Period Moving Average Bearish (https://www.tradingview.com/x/cPl2HehQ/)
Referencing Figure 3 and Figure 4, the 180 Day Moving Average serves the same purpose as an ascending or descending trendline.
Significance of a Break of Trendline
This segment touches on significant trendline breaks on both bullish and bearish markets.
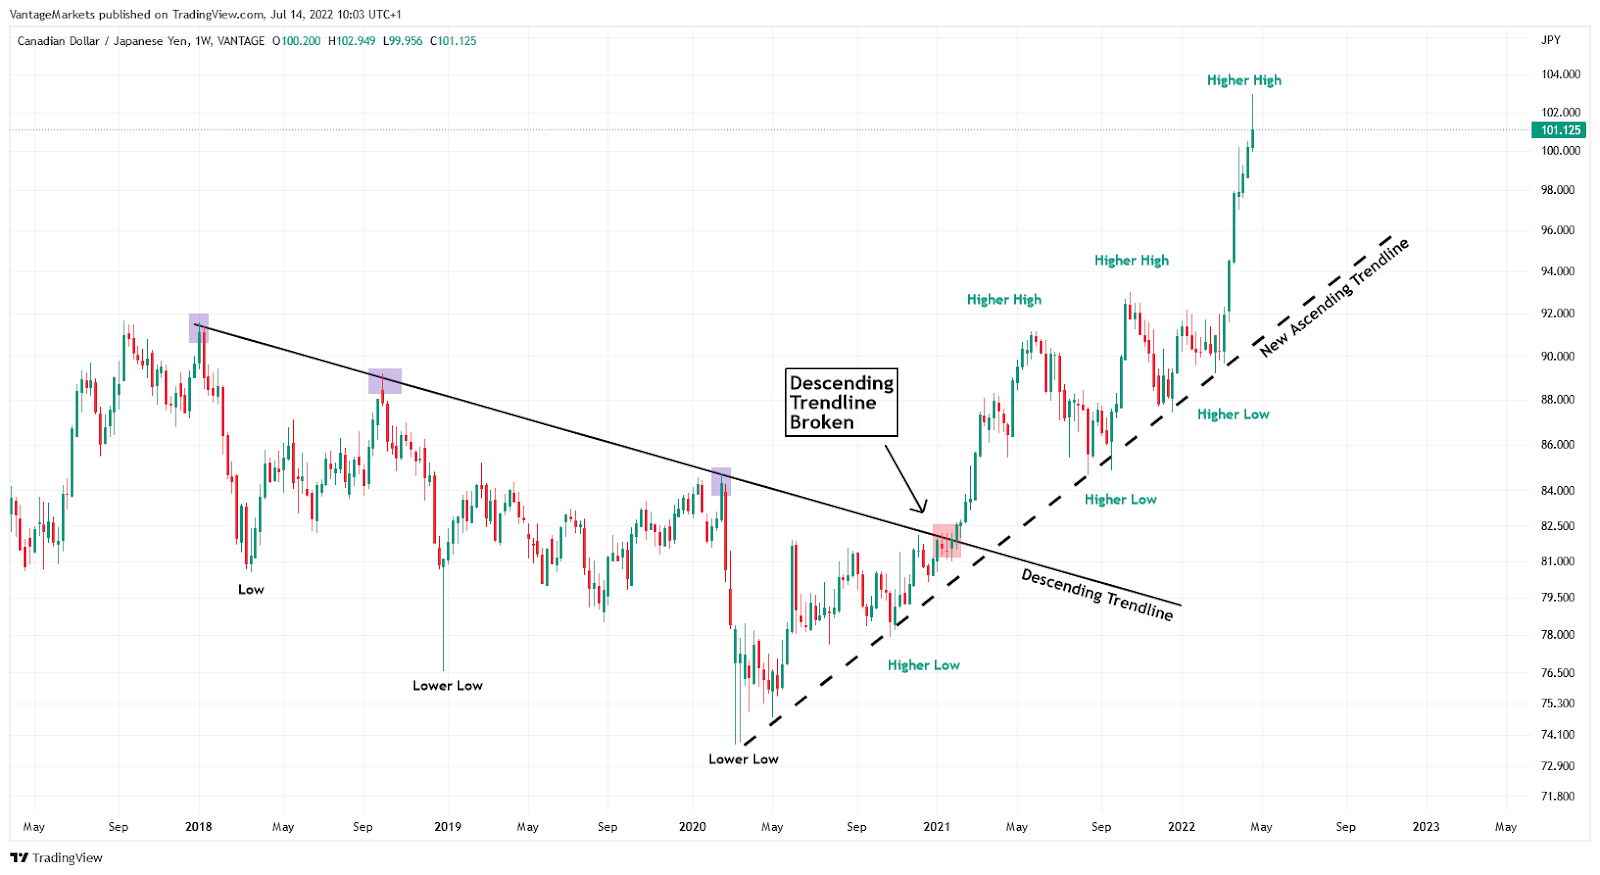
Figure 5 – CADJPY W1 Break of Descending Trendline (https://www.tradingview.com/x/F0s4fTxu/)
In Figure 5, the dominant trend initially was bearish which was further supported by the descending trendline. However, there came a point in time where CADJPY markets broke above the descending trendline. This signifies a change in market dynamics from a bearish market to a bullish market. This idea is further perpetuated by the new ascending trendline that supports the bullish market taking dominance [3].
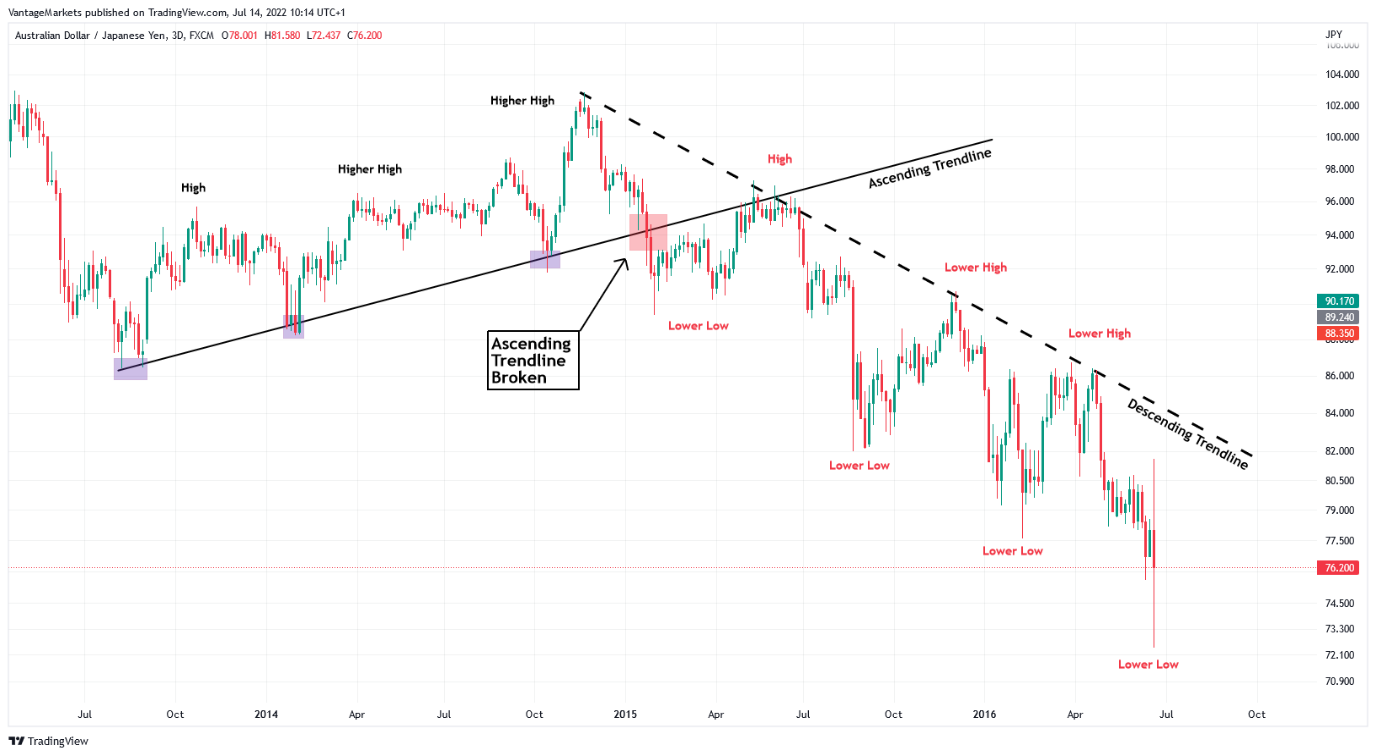
Figure 6 – AUDJPY D3 Break of Ascending Trendline (https://www.tradingview.com/x/dG0Zgq3g/)
Figure 6 showcases the opposite scenario from Figure 5. Initially. The dominant rend was bullish, supported by an ascending trendline and AUDJPY markets forming higher lows and higher highs. However, once there was a break of the ascending trendline structure, there is a shift from a bullish market to a bearish market. This new bearish trend is supported by the descending trendline and the formation of multiple lower highs and lower lows.
What Are Counter Trendlines?
The full potential of a trendline is only limited to its user. This segment goes through another practical use of the reliable trendline.
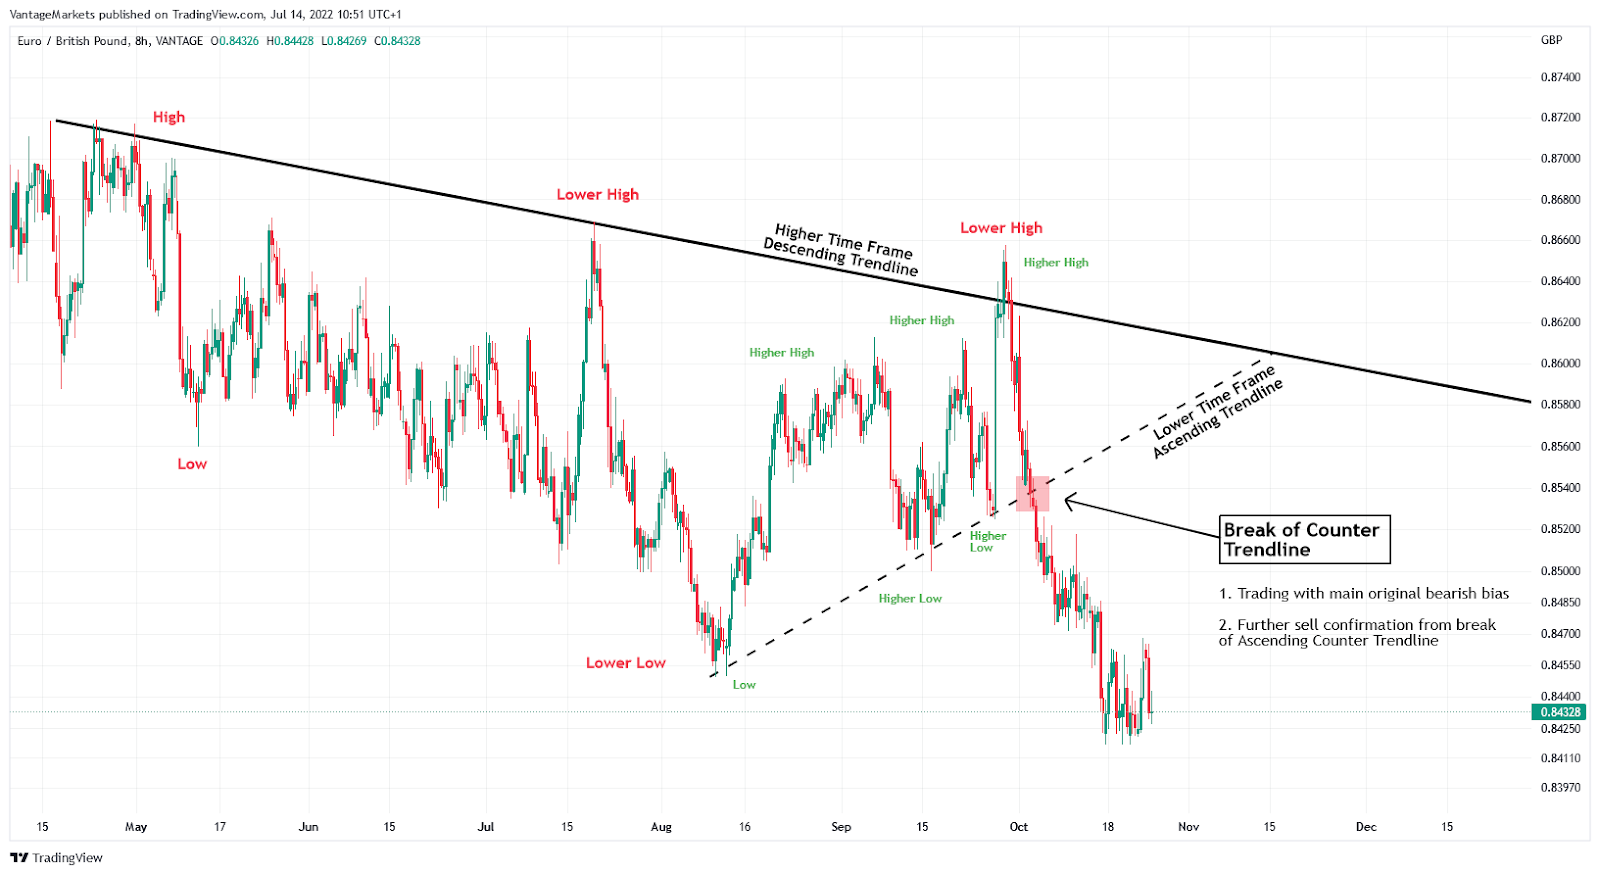
Figure 7 – EURGBP H8 Ascending Counter Trendline (https://www.tradingview.com/x/cpZVgqDe/)
The counter trendline is usually applied to a minor trend within a major trend.
In Figure 7, the major bearish trend is supported by the descending trendline on the H8 chart while the ascending counter trendline supports the minor uptrend. In this scenario, the breaks of the ascending counter trendline provides additional confluence of an overall bearish market still holding weight.
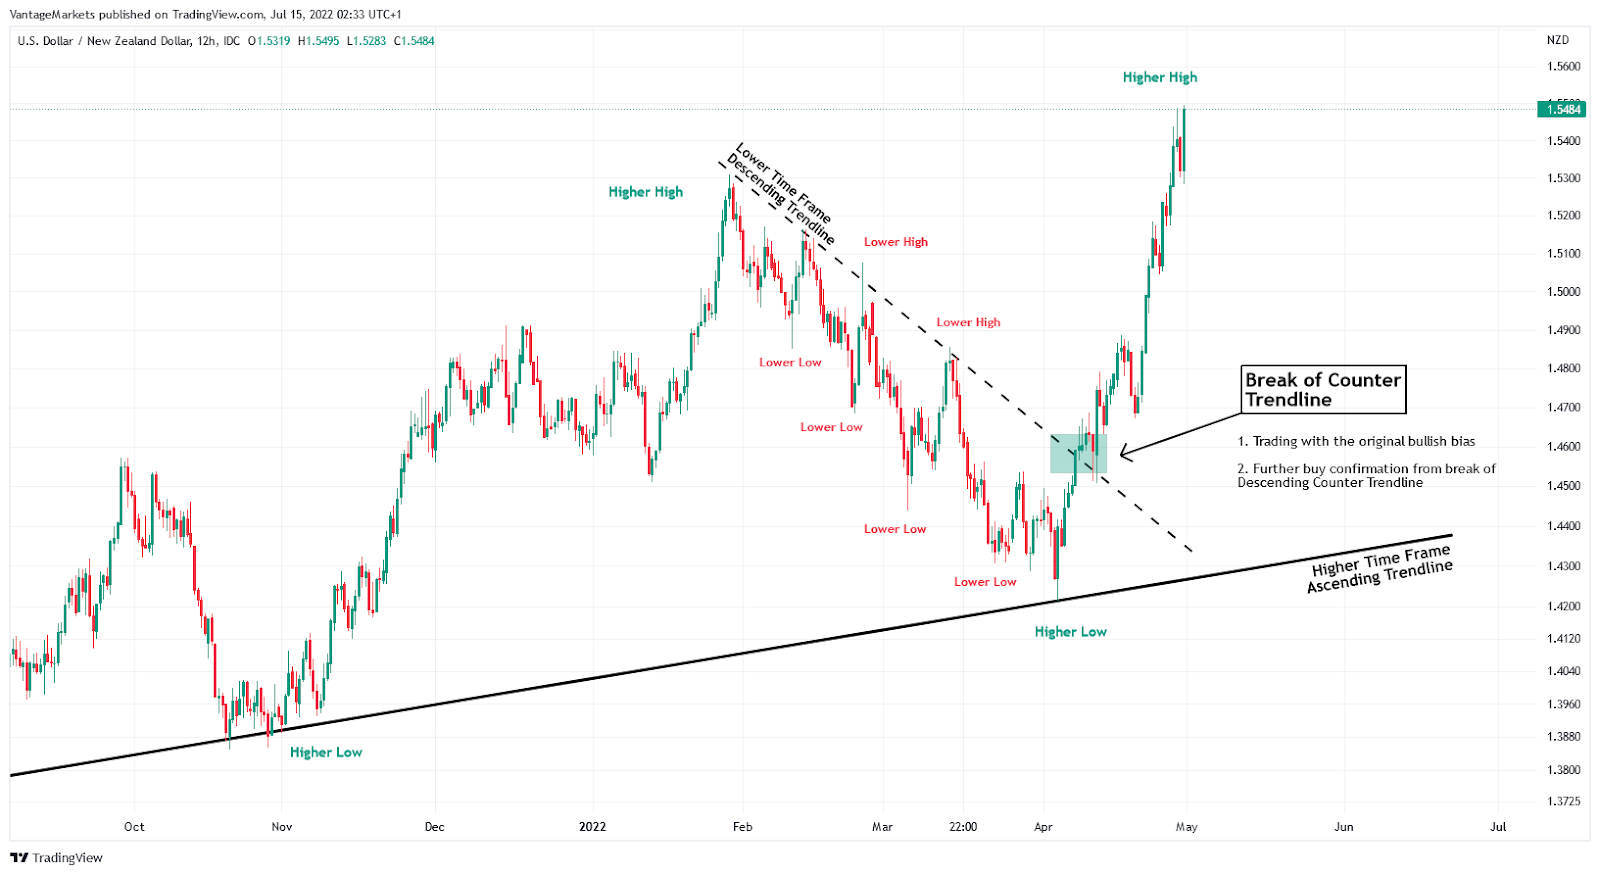
Figure 8 – USDNZD H12 Descending Counter Trendline (https://www.tradingview.com/x/NYNAzPsd/)
USDNZD in Figure 8 can be seen trading in bullish market conditions with markets forming higher lows and higher highs on an ascending trendline. As markets approach the major ascending trendline for a tap, candlestick formation shows a minor bearish market structure affirmed by the descending counter trendline. Breaks of the counter trendline further confirms that bullish market conditions still hold dominance.
What Are Trendline Patterns?
Once a trend is determined and is supported by an ascending or descending trendline, there are patterns that a trader can spot.
Ascending trendlines supporting bullish markets tend to show “M” patterns. Conversely, descending trendlines supporting a bearish market shows “W” patterns.
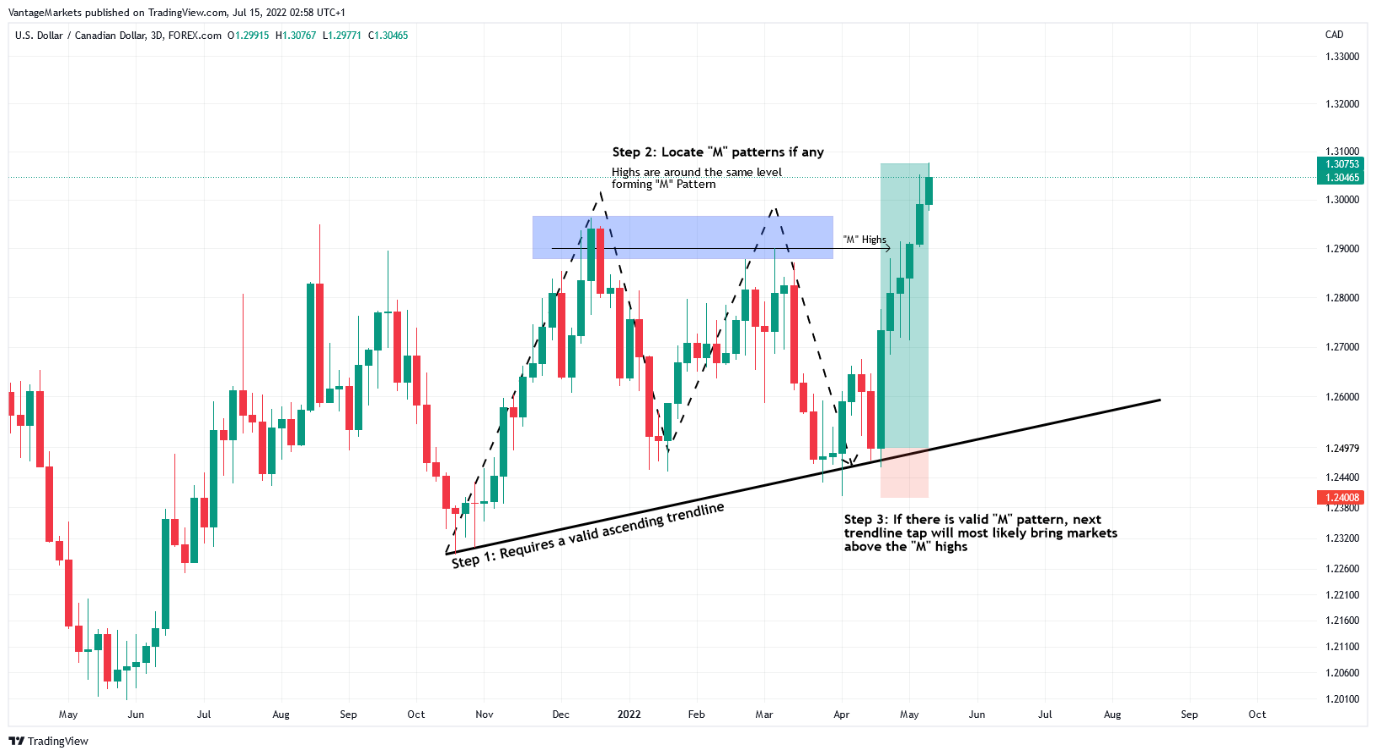
Figure 9 – USDCAD D3 Ascending Trendline “M” Pattern (https://www.tradingview.com/x/P6yzrldz/)
Figure 9 depicts an “M” pattern on an ascending trendline. Within the “M” pattern, the highs are formed around the same level [4] indicated by the blue box. The markets following the formation of the “M” pattern usually extends higher, above the blue box.
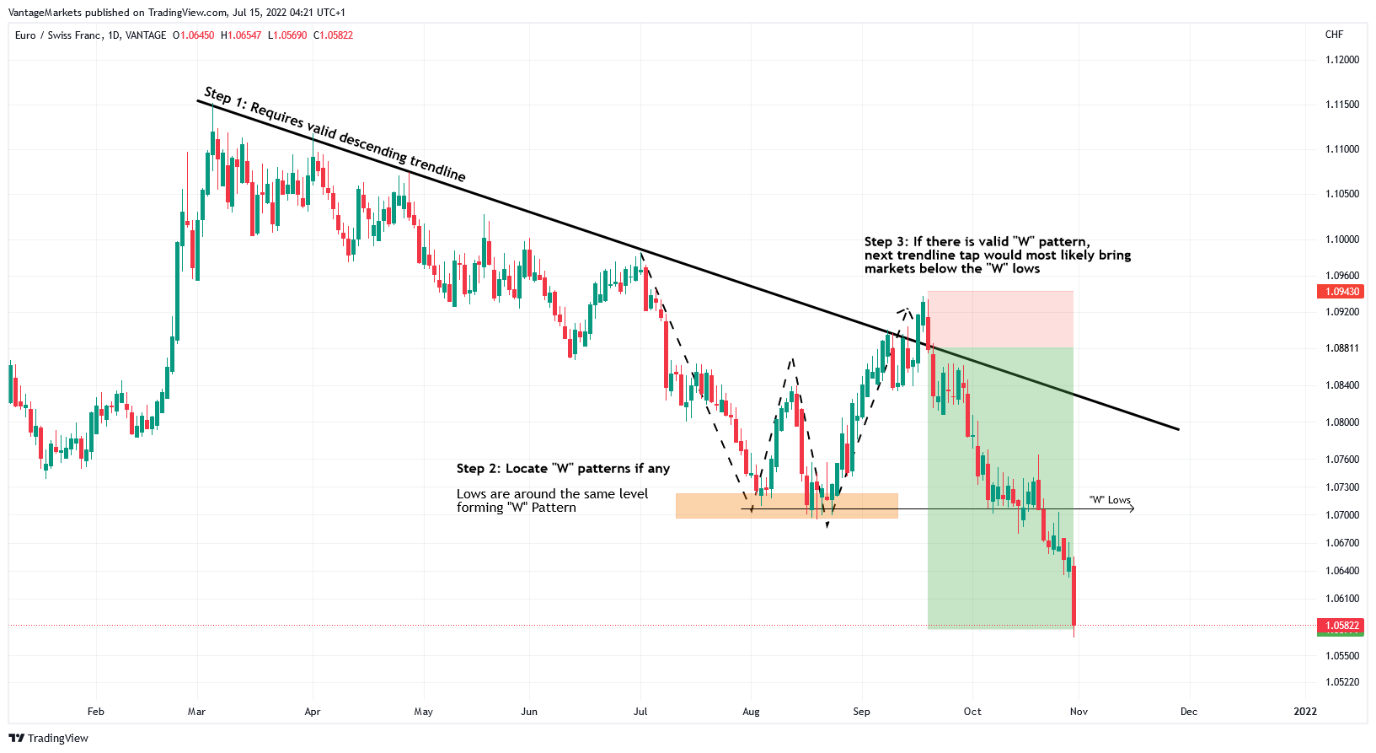
Figure 10 – EURCHF D1 Descending Trendline “W” Pattern (https://www.tradingview.com/x/1YkjFUM0/)
Figure 10 is a “W” pattern on a descending trendline. Within the “W” pattern, the lows are formed near an equal level [4] indicated by the orange box. Upon completion of a “W” pattern, the markets following it usually extends lower, below the orange box.
“M” and “W” patterns can be found on their respective trendlines, but this is not always the case. When it does, take note of the characteristics of the equal highs in the “M” patterns and equal lows in the “W” pattern, and how the following markets tend to break above or below the highs and lows.
How To Execute Trend Trading?
As an individual continues to build competency in their ability to dictate a trend, trading confidence naturally follows. This may open more trading opportunities to trade with the trend.
Here are two trend trading strategies that one may consider implementing into their arsenal.
The examples below are used for educational purposes only. Past performance is not an indication of future results and any reliance on such as at your own risk.
Trend Trading Strategies
There are many different forms of trend trading, and this segment focuses on two.
Case Study 1 – Major Trendline & Counter Trendline Strategy
Case study 1 shows a buy trade on AUDJPY using a main trendline and counter trendline.
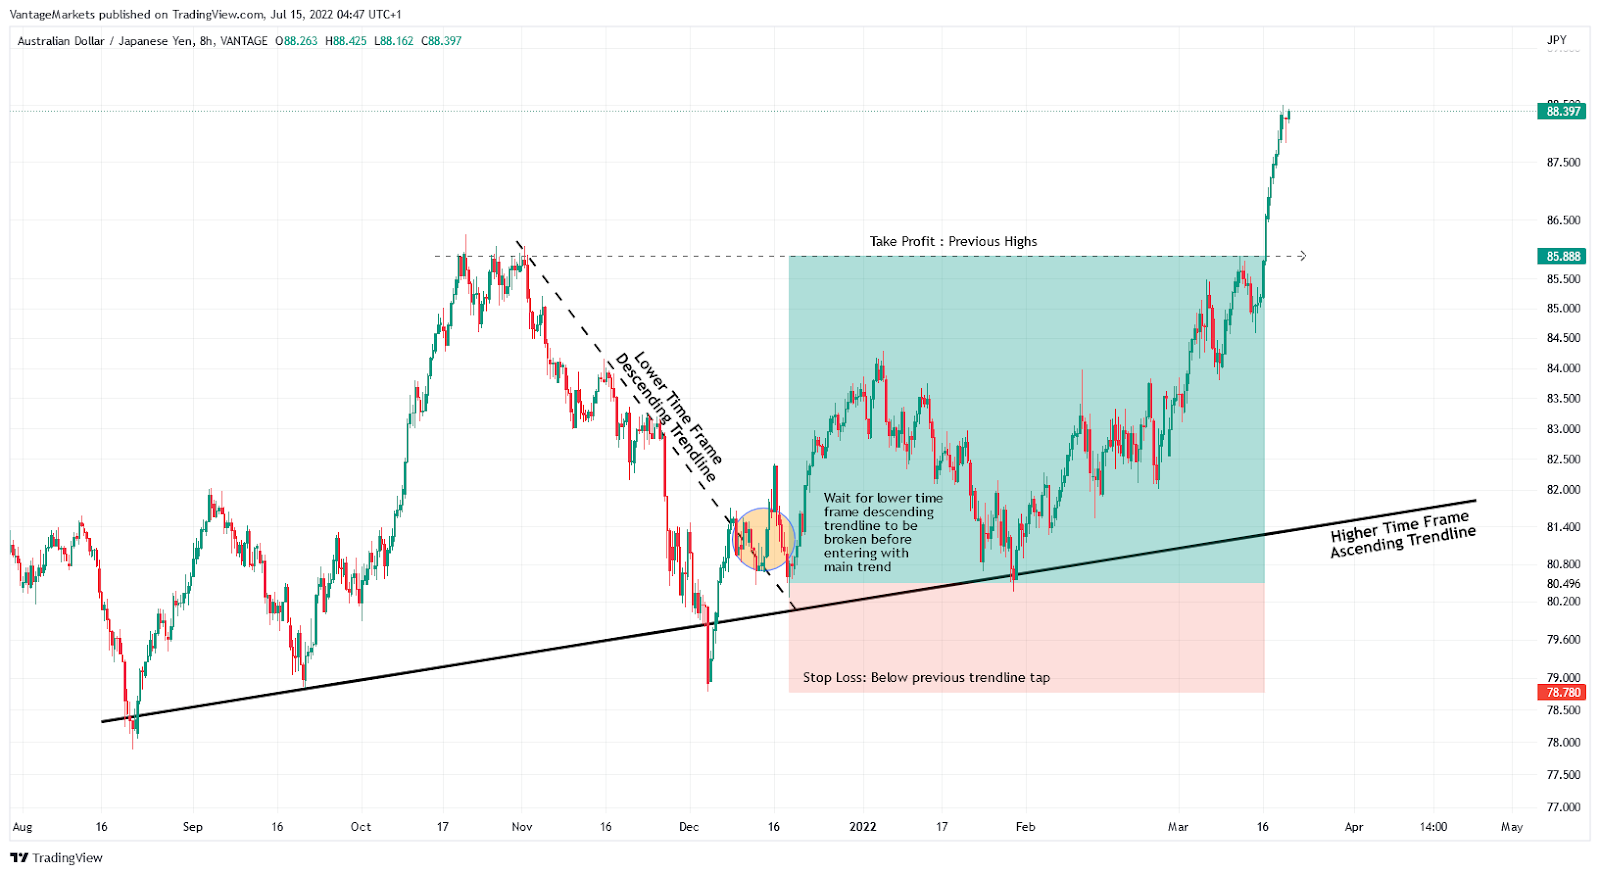
Figure 11 – AUDJPY H8 Trendline Trading Strategy (https://www.tradingview.com/x/ilocEIEX/)
1. Establish a higher timeframe trend, supported by a trendline. In Figure 11, the higher timeframe trend is bullish, evidenced by the ascending trendline and markets forming higher lows and higher highs.
2. As market approaches the trendline, a descending counter trendline can be added.
3. Wait for markets to break above the descending counter trendline – shown by the circle in the image above. This would show the bullish markets are still dominant.
Case Study 2 – Moving Average Crossover Strategy
Case study 2 shows a sell trade on AUDSGD using two moving averages.
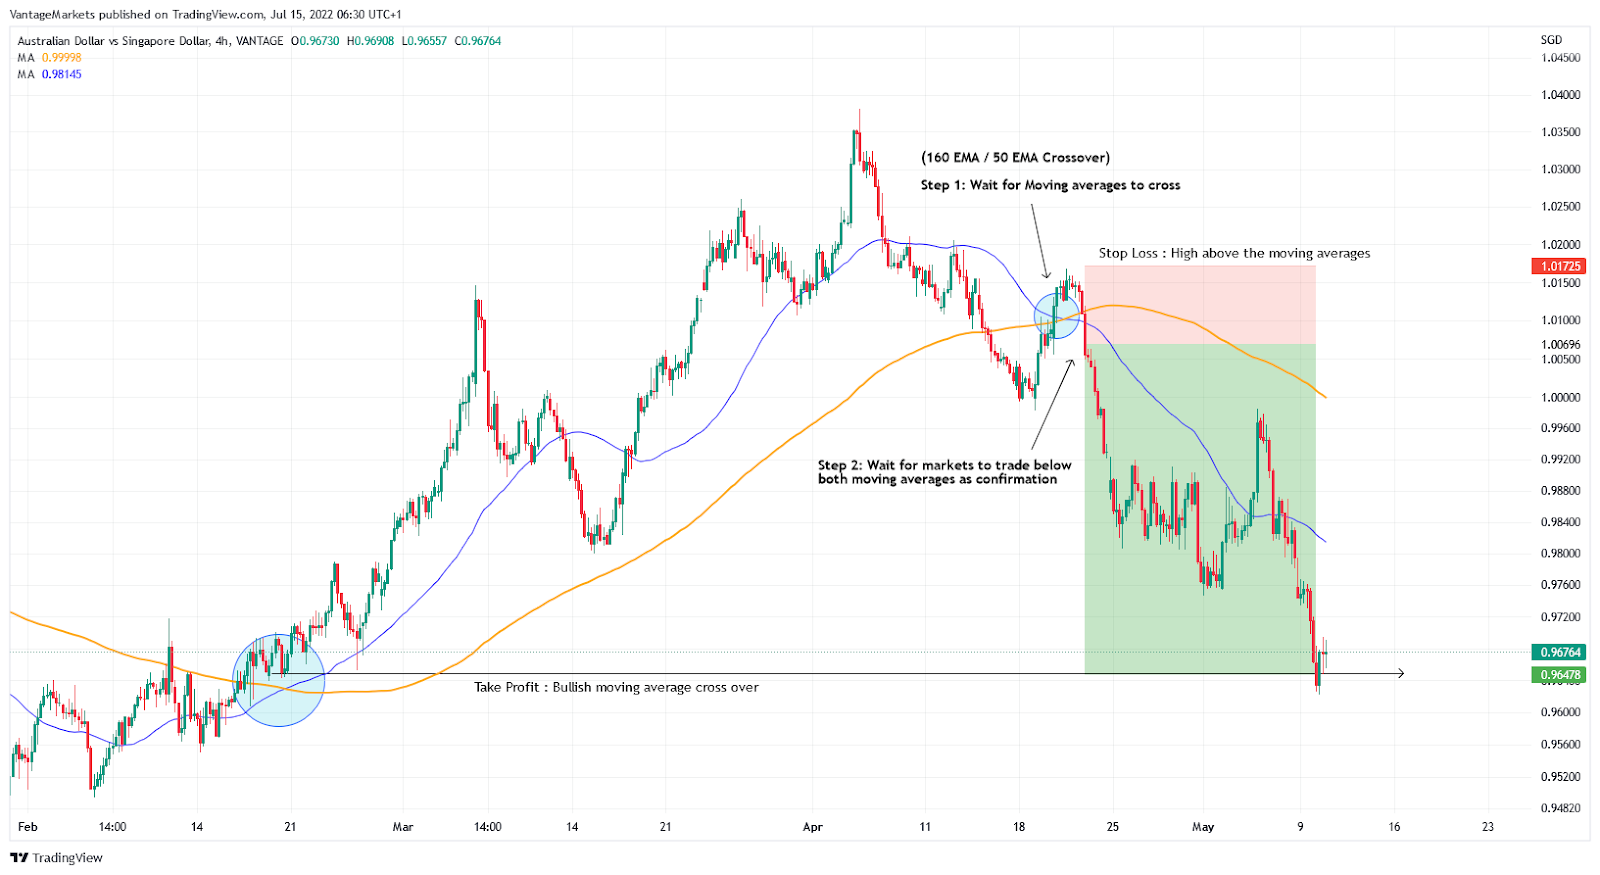
Figure 12 – AUDSGD H4 Moving Averages Trend Trading Strategy (https://www.tradingview.com/x/tZb63q8A/)
1. Using a 160 Day Moving Average (orange) & 50 Day Moving Average (blue) to determine a trend.
2. Figure 12 shows the 50 Day Moving Average crossing below the 160 Day Moving Average. This highlights a possible bearish trend starting.
3. Further sell confirmations arise only when markets trade below both Moving Averages.
Types of Market Trends
Markets can trend two ways, bullish or bearish. However, much more detail can be uncovered when looking at the structure of trending markets, especially from a broader picture zooming in. this segment uncovers two different perspectives to view market structure.
Trend-Consolidation-Trend Structure
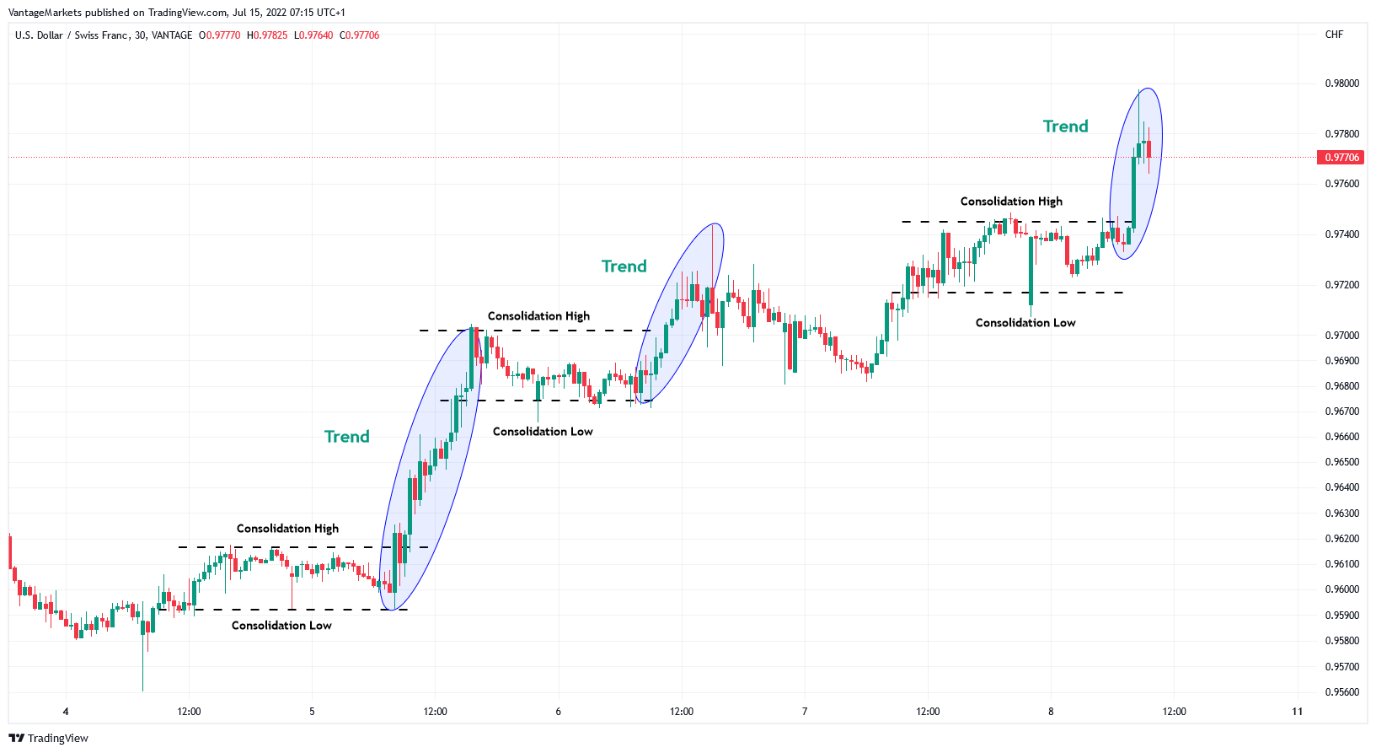
Figure 13 – USDCHF M30 Trend-Consolidation-Trend Bullish Structure (https://www.tradingview.com/x/VwUq899l/)
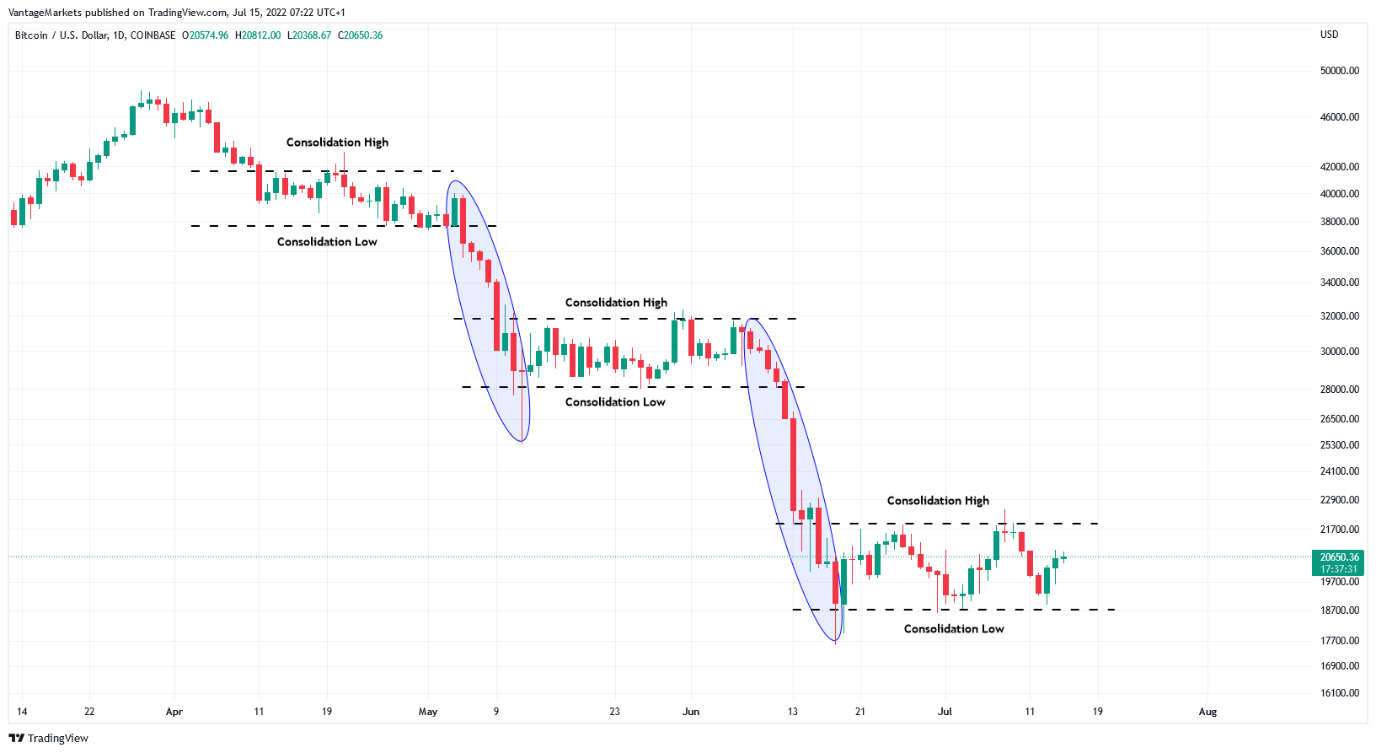
Figure 14 – BTCUSD D1 Trend-Consolidation-Trend Bearish Structure (https://www.tradingview.com/x/95R0xEIt/)
From a trend-consolidation-trend point of view, markets behave like a spring [5].
When a spring is compressed, it builds potential energy. This is equivalent to market consolidation. Consolidation in the markets is often followed with a trend. Just like a compressed spring being released, it moves aggressively and strongly.
From a trend trading point of view, any consolidations in the markets could alert a trader that a trend may soon follow, creating trading opportunities.
Impulsive & Corrective Waves
Impulsive waves are market moves that go with the main trend. Corrective waves go against the main trend and are generally weaker than impulsive waves [6].
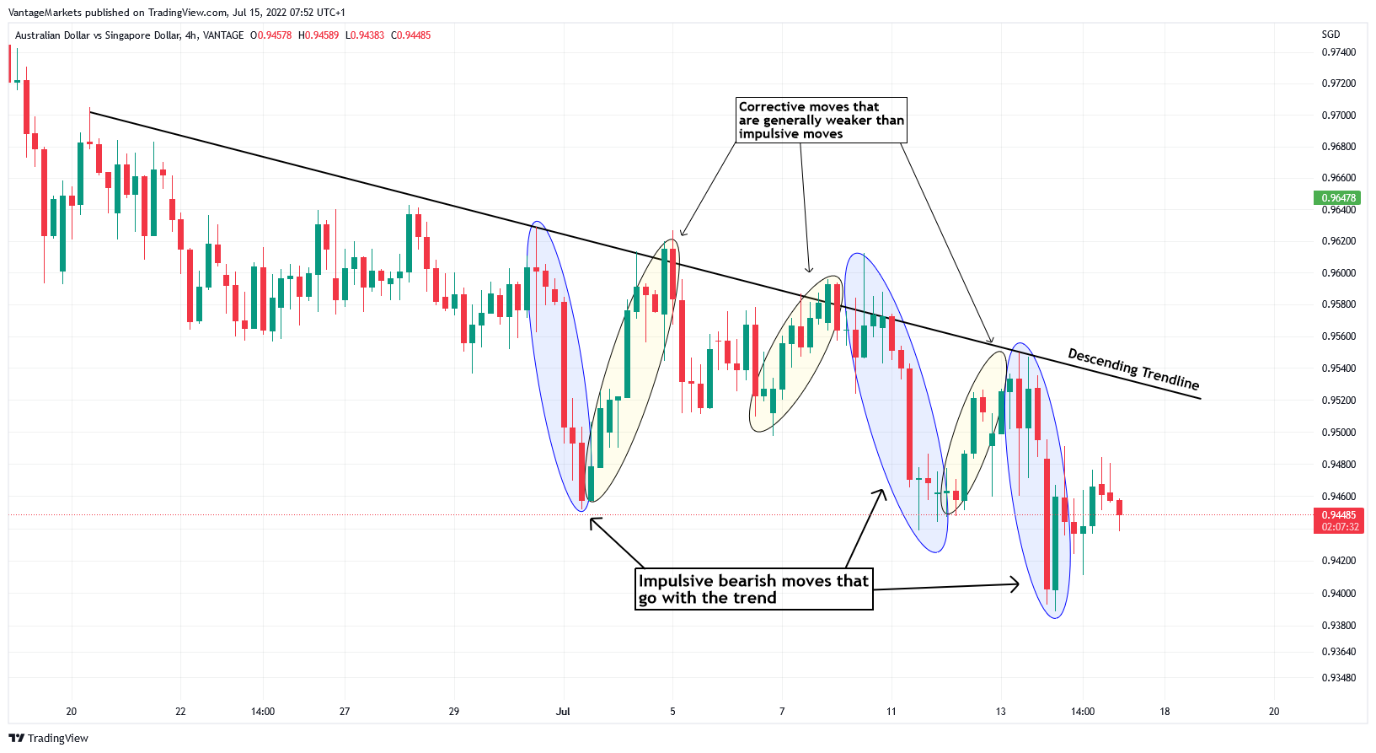
Figure 15 – AUDSGD H4 Bearish Market Impulsive Corrective Waves (https://www.tradingview.com/x/PxDaOdSy/)
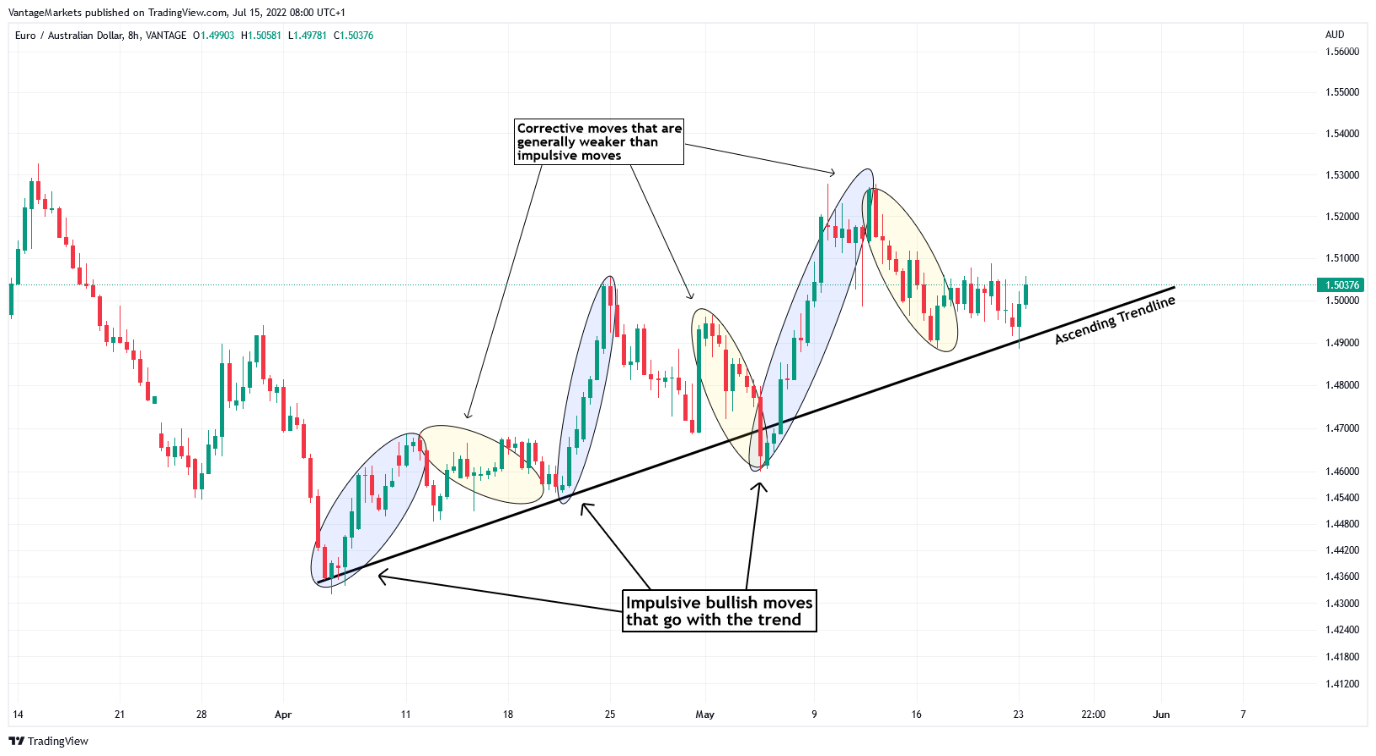
Figure 16 – EURAUD H8 Bullish Market Impulsive Corrective Waves (https://www.tradingview.com/x/0MCfSfMd/)
Due to the nature of corrective waves being weaker than impulsive waves, the size of the candle bodies for corrective waves are smaller than that of impulsive waves. When trying to analyse and determine the overall trend, traders can look for a succession of strong bodied candles for confluence.
Limitations of Trend Analysis
As with any technical tool in trading, none of it is perfect and does come with limitations.
Over Trading
Dependent on the timeframe used, markets are not always trending. Hence, having a trading plan lowers the chances of over trading –entering the markets too often when conditions are not in your favour.
Late Entries
Trend trading based on indicators could have an impact on the risk to reward ratio of a trader. Moving Averages are lagging indicators which could result in a trader entering near the end of a trend.
Conclusion
Trend analysis need not be a complicated process. Using something more straightforward like a trendline or Moving Average could assist your trading journey. Remember that the trend is your friend and the best thing any trader can do is to back test and practice. Want to practice Trend Analysis on the markets? Try practicing it through your own Forex Demo Account.
References
- “Trendline Trading: What to Do (And Not to Do) – My Trading Skills” https://mytradingskills.com/trendline-trading Accessed 2 Sept 2022
- “How to Use Moving Averages to Find the Trend – Babypips” https://www.babypips.com/learn/forex/using-moving-averages Accessed 2 Sept 2022
- “Trade Broken Trendlines Without Going Broke – Investopedia” https://www.investopedia.com/articles/trading/07/broken-trendlines.asp Accessed 2 Sept 2022
- “Complete Guide on MW Pattern Indicator – Investsocial” https://investsocial.com/forum/trading-software/indicators-for-mt4-mt5/223728-complete-guide-on-mw-pattern-indicator Accessed 2 Sept 2022
- “Coiled Market: What it Means, How it Works, Example – Investopedia” https://www.investopedia.com/terms/c/coiledmarket.asp Accessed 2 Sept 2022
- “Understanding Impulsive And Corrective Price Action – 2nd Skies Trading” https://2ndskiesforex.com/forex-strategies/impulsive-and-corrective/ Accessed 2 Sept 2022