What is Market Volatility?
Volatility is the measure of the rate of fluctuations in the value of a financial instrument over a period of time. If the price of a security fluctuates rapidly in a short period with wild swing to new highs or lows, it can be perceived as having high volatility. On the contrary, if the movement of the stock price is relatively stable with slow and small changes in value, it is said to have low volatility. High volatility often leads to fear in the market due to its association with risk and uncertainty, but for well-informed and experienced investors, it may not always be so. While we should not disregard the fact that market volatility carries increased risks, there are potential investment opportunities for those who know to use volatility to their advantage and practice good risk control measures.
Reasons For High Market Volatility in The Markets
Volatility within the financial markets is usually derived from fundamental factors such as geopolitical events, economic data, industry & sector performance, and company performance.
Geopolitical Events – Every government plays a significant role in supporting economic stability within the nation. Hence, any sudden surprise or changes could cause knee-jerk reactions in the financial markets. For example, the former US president Donald Trump announced trade tariffs against China in 2019, and what followed was a sharp drop in the S&P 500 index (SPX).
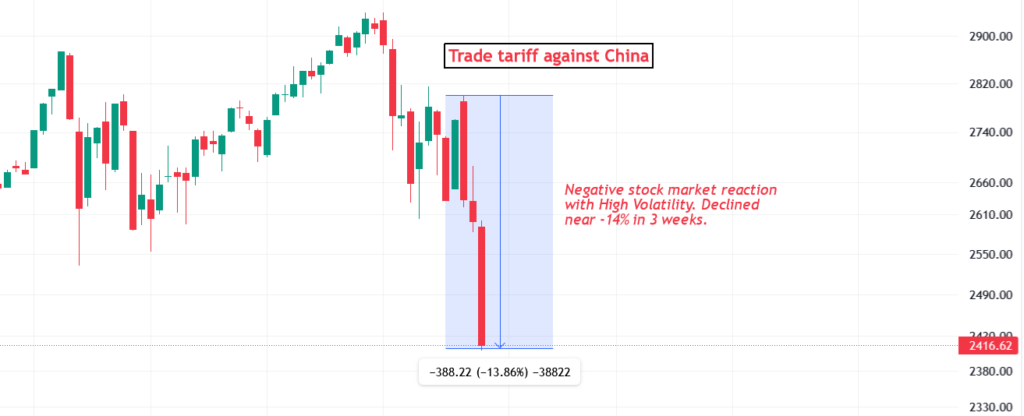
Figure 1 highlights the increased volatility from such a geopolitical event. The SPX declined by nearly 14% in a matter of 3 weeks. In comparison, the SPX markets took 25 weeks to gain the exact same amount in the past.
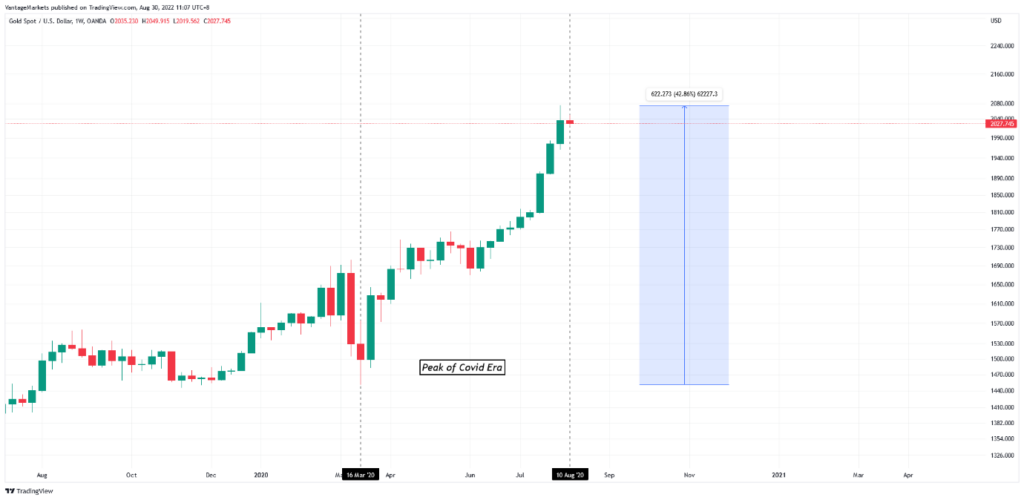
Another example of geopolitical factors affecting volatility would be the Covid era. When the pandemic struck nations worldwide, the global shutdown led to massive fear and uncertainty economically. This led to the precious metal gold rising by almost 43%, trading above the $2000 for the very first time.
Economic Data – Different forms of economic data within a nation paints a picture of its health. Factors such as labour market data, inflation, manufacturing, interest rates, GDP etc., can cause volatility if there is a huge slippage in the released data versus the consensus.
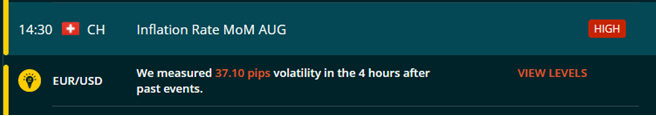
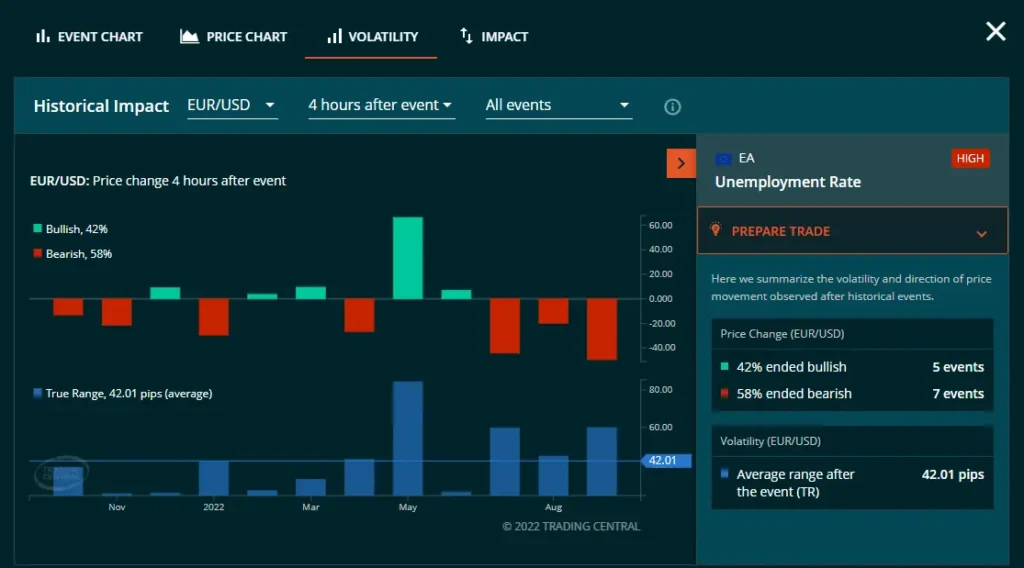
On Vantage’s Protrader Tools Economic Calendar, the economic data comes with volatility expectations. Vantage calculates the historical impact of a news event on popular pairs such as EURUSD to inform traders of the technical impact of a fundamental event.
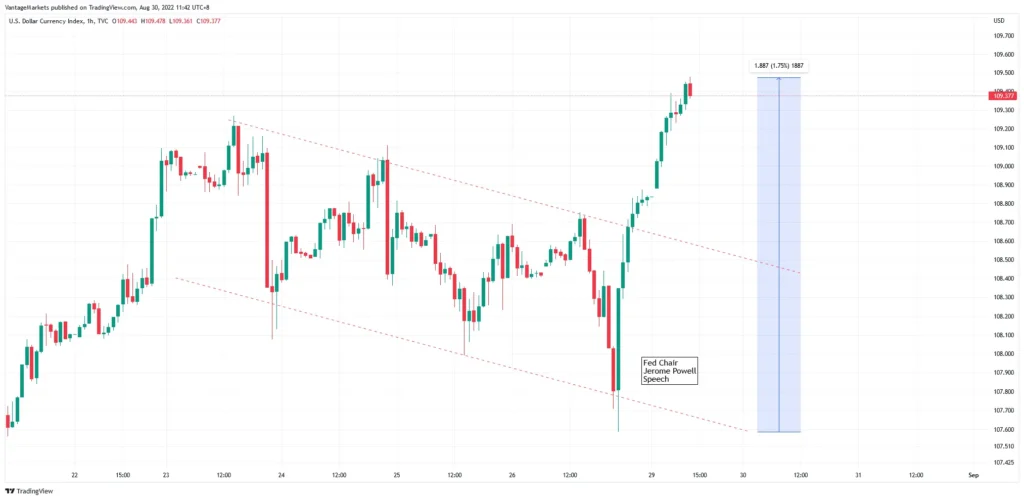
In Figure 3, the Dollar index rose by 1.75%, having a technical breakout of the descending channel. Such an impulsive bullish move is most likely a result of certain economic data. In this case, it was due to a scheduled speech by Fed Chairman Jerome Powell. His hawkish remarks reportedly brought in increased volume and volatility which led dollar to extend higher.
Industry & Sector Factors – The collapse of the housing industry in the US back in 2008 is one example to look at. Extremely low interest rates and easy lending standards were the catalysts that fuelled a housing bubble in the US. This led to a full-blown recession and stock markets had one of the most drastic collapses [1].
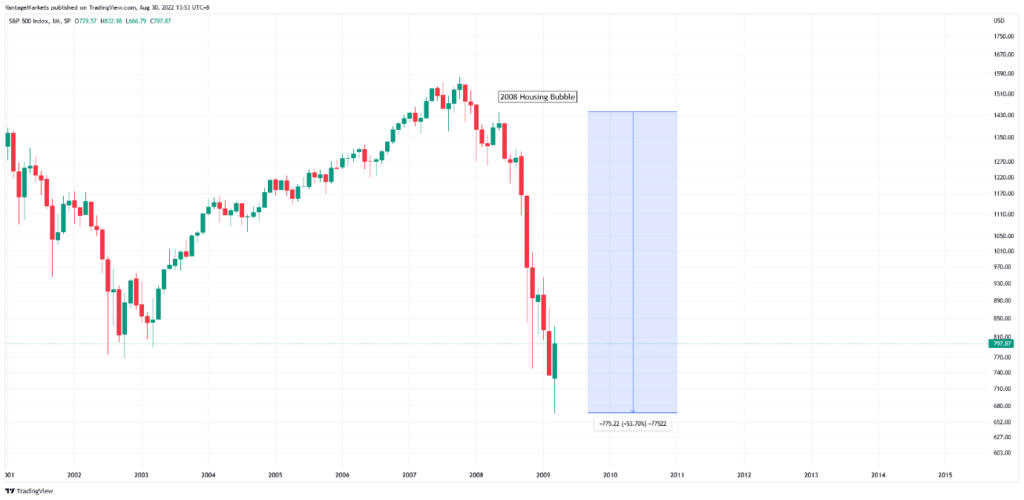
An almost 50% decline in the S&P500 on the monthly chart is shown in Figure 4. The collapse cancelled out 5 years’ worth of bullish gains in a matter of 10 months.
Company Performance – Volatility does not just affect the broader market but can also impact the individual stock as well. Strong earnings report or the release of a new product or service could potentially blow in a wave of volatility. The positive news or announcements would often lead to optimism among investors which reflects an increased demand for the company’s stock, raising its stock prices.
Apple is the prime example of how the scheduled release of a product could impact the market. Ever since the first iPhone release in 2007, Apple has released 22 other versions as of 2022. 16 out of the 22 iPhone releases have led to the increase of Apple stock price 30 days after the launch [2].
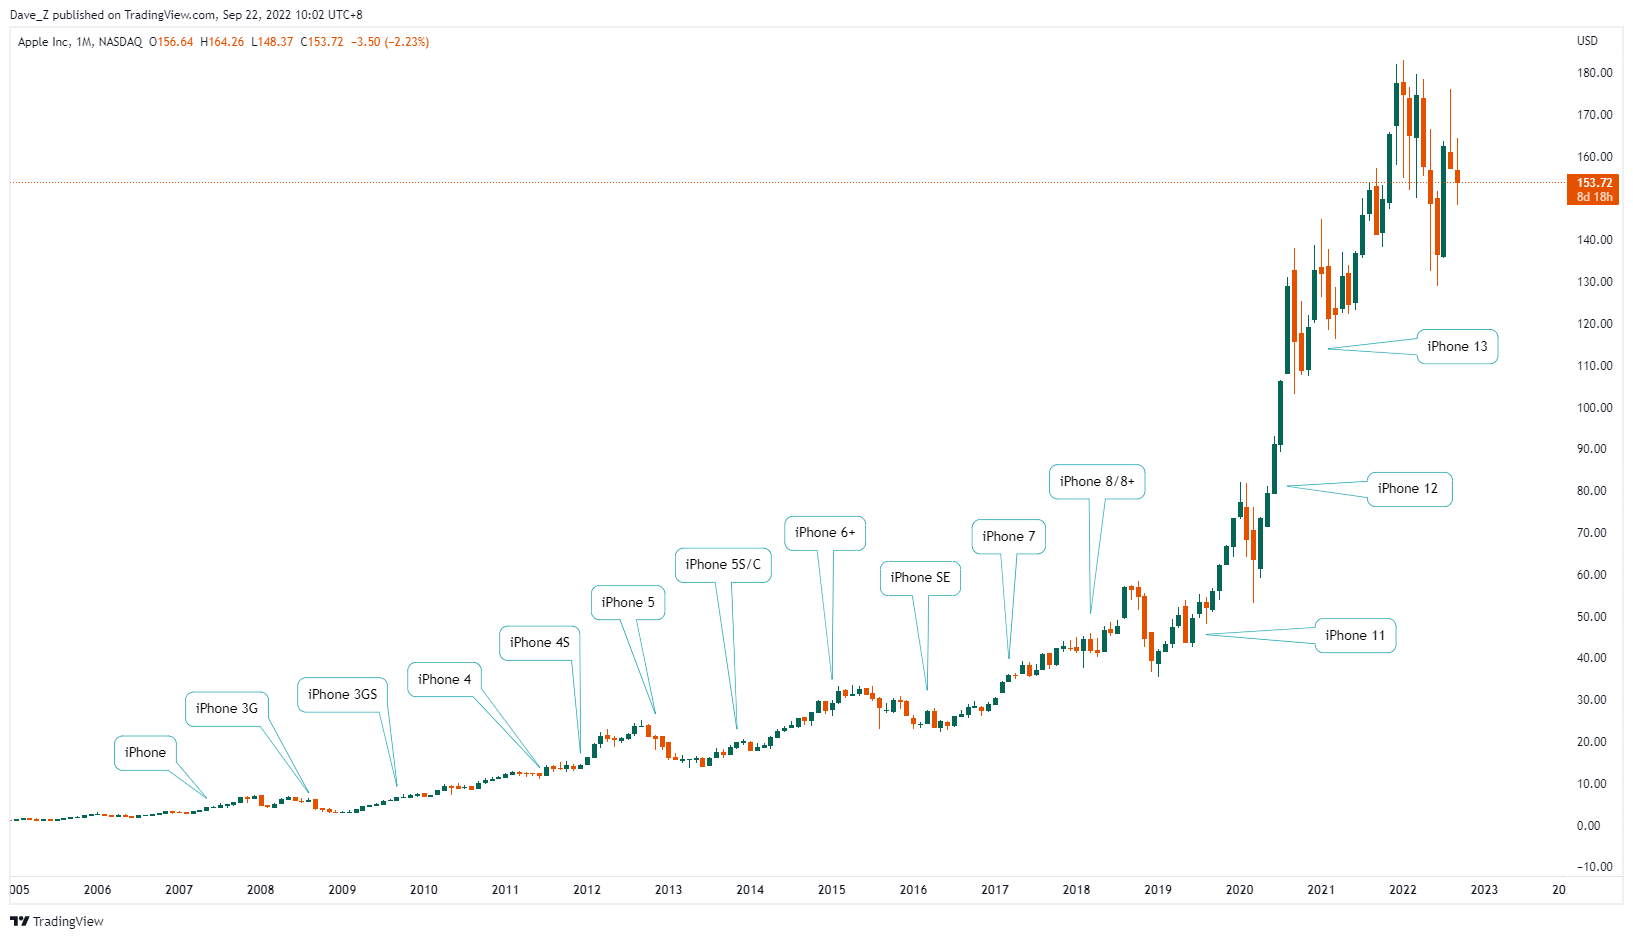
In Figure 5, it shows the month of release for iPhones and the market following the release.
Tools to Measure Market Volatility – There are two major tools that measures volatility in the stock market: Beta and VIX. Both methods measure market volatility, but their usage greatly differs.
What is Beta?
Beta is the measure of volatility of an individual stock and the Beta of each stock shows its relative risk to the index. In other words, a specific stock’s Beta is being compared to the whole index’s Beta (S&P500). A positive Beta greater than 1.0 would suggest a more volatile stock as compared to the broader market, while a negative beta smaller than 1.0 hints less volatility in a stock compared to the broader market [3].
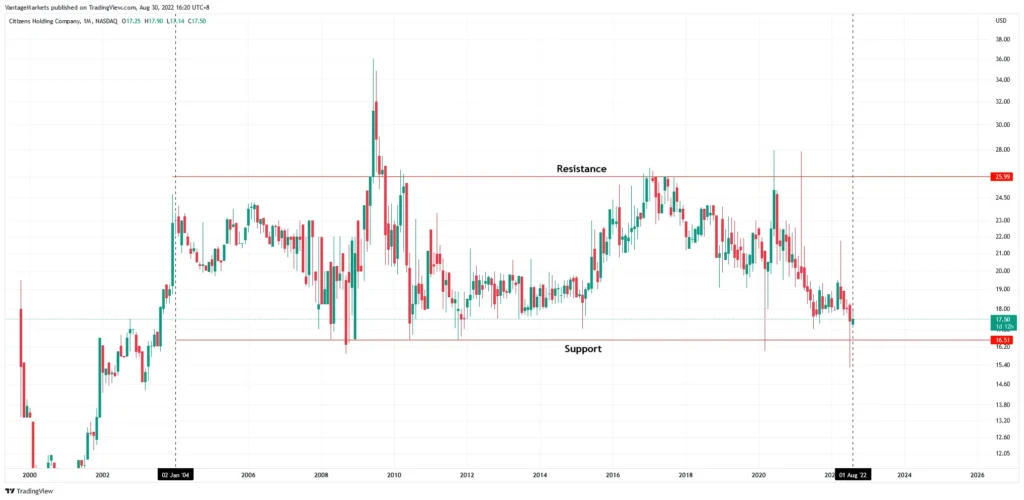
Figure 6 shows Citizen Holding Company, a low Beta stock, on the monthly chart. Over the span of 18 years, CIZN has been trading within a range denoted by the red support and resistance line.
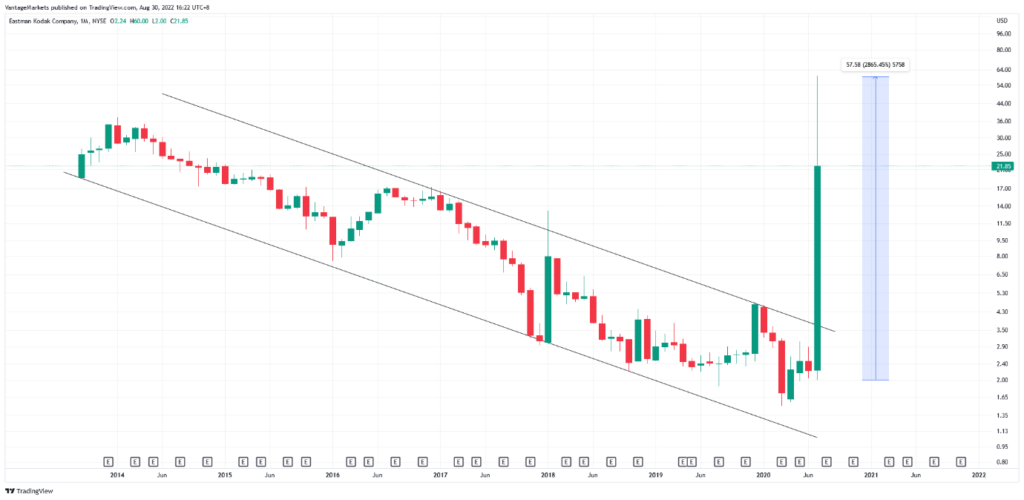
As compared to Figure 7, highlighting Eastman Kodak Company, a high beta stock, on the monthly chart. KODK made close to 3000% gain during August 2020, having a strong technical breakout from the descending channel.
What is VIX?
VIX also known as the volatility or fear index, represents the market’s expectations for the relative strength of near-term price changes of the S&P500. As compared to Beta, which is hindsight, VIX is derived from S&P500 options which generates a 30-day forward projection of volatility. Investors usually use the VIX as a measure of market fear, uncertainty, and doubt [4].
The value of the VIX oscillates between values 20 and 30. Values greater than 30 showcases perceived fear in the markets in which investors tend to move their assets. If the value of VIX is below 20, markets reflect certain potential optimism.
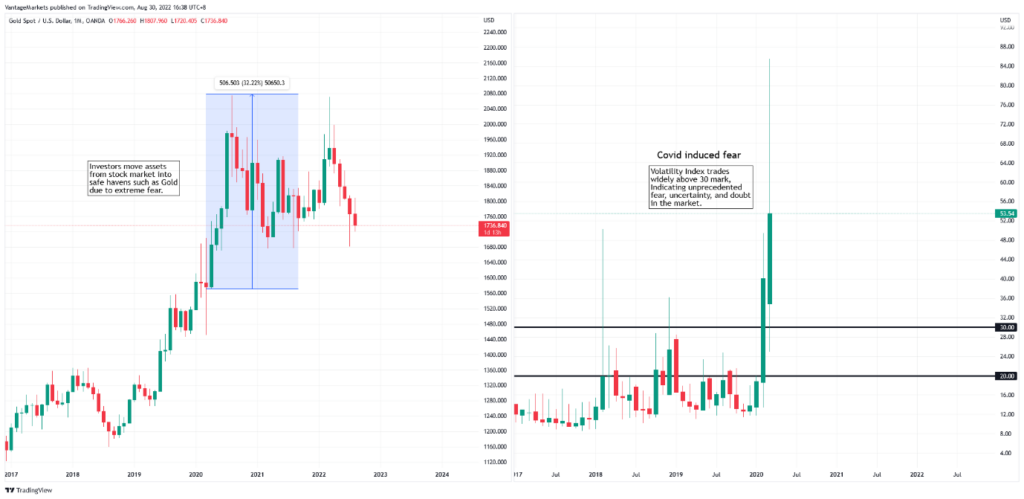
Figure 8 highlights the usage of VIX. During the Covid era, fear flooded the financial markets due to a global economic shutdown. Hence, the value of VIX escalated to 85, which is well above the 30 benchmarks. Gold being a traditional asset, increased in value as investors rush to convert assets into this yellow precious metal, gaining a total of 32%.
| Volatility Tool / Characteristics | Beta | VIX |
| Usage | Used mainly to diversify short-term to long-term investments. | Used mainly to determine fear and optimism in the stock markets. |
| Values | Values below 1.0 considered low volatility stock. Values above 1.0 considered high volatility stock. | Values below 20 highlights optimism attitude in the stock market. Values above 30 highlights fear, uncertainty, and doubt in the stock markets. |
| Action | Long-term investors tend to prefer stocks with Beta value below 1.0. Short-term investors tend to prefer stocks with Beta value above 1.0. | Investors tend to shift their assets into traditional assets when VIX is above 30. Investors tend to shift their assets from traditional back into the stock market when VIX is below 20. |
Final Words
As mentioned, there are potential investment opportunities even during a volatile market. Using tools such as Beta and VIX, an investor can diversify their portfolio with both short- or long-term investments.
Looking to ride the market’s high volatility? Try practicing it through your own Forex Demo Account.
References
- “The 2007–2008 Financial Crisis in Review – Investopedia” https://www.investopedia.com/articles/economics/09/financial-crisis-review.asp Accessed 20 Sept 2022
- “Here’s How Apple’s Stock Has Done After Every iPhone Release – Fortune” https://fortune.com/2016/09/09/apple-stock-iphone-launches/ Accessed 20 Sept 2022
- “What Beta Means When Considering a Stock’s Risk – Investopedia” https://www.investopedia.com/investing/beta-know-risk/ Accessed 20 Sept 2022
- “CBOE Volatility Index (VIX): What Does It Measure in Investing? – Investopedia” https://www.investopedia.com/terms/v/vix.asp Accessed 20 Sept 2022