Stocks and bonds rise after stellar GDP with soft inflation

* ECB held rates steady, but reports say open to March pivot and June cut if data allows
* US GDP grew 3.3% last quarter, capping unexpectedly strong year
* US dollar up after GDP data, euro falls after ECB, Lagarde comments
* Tesla plunged as it makes it harder for investors to ignore its problems
FX: USD tried to push decisively north but the 200-day SMA proved resistance again at 103.49. The greenback got no help from falling Treasury yields. US data was generally better than expected. GDP smashed expectations but does bring with it the concern that weakness is approaching. Inflation figures were also highly encouraging.
EUR sunk after the ECB meeting came in more dovish than expected. President Lagarde failed to explicitly push back against earlier policy easing than the summer. She stated it was premature to talk about cuts, but underlying inflation and wage growth are seen falling further this year. The latest IFO German business survey also made grim reading as it dropped to its lowest level since summer 2020. This potentially points to another quarter of contraction. EUR/USD threatened to break through the 200-day SMA at 1.0843 but closed just above. Next support is just below 1.08.
GBP gave back some of the prior day’s gains in a relatively narrow range. The more aggressive repricing of rate cuts priced into the UK curve is underpinning support for the pound.
USD/JPY printed a doji candle even though Treasury yields pulled back. Yesterday’s and this week’s low is 146.51. Focus will turn to the Tokyo CPI data, which is a precursor for the nationwide print released in around two week. The core is forecast to cool further to 1.9% versus 2.1% in December.
AUD continues to trade around the 200-day SMA at 0.6576. The China bump in stocks is helping support the aussie and kiwi. USD/CAD fell marginally below its 200-day SMA at 1.3482. FX markets focused on the removal of the tightening bias in yesterday’s BoC policy statement. But there were clear worries about inflation and a higher for longer phase.
Stocks: US equities were generally bid but the Nasdaq underperformed. The benchmark S&P 500 advanced 0.53% to settle at 4,894. The tech-dominated Nasdaq 100 added 0.10% to finish at 17,516. The Dow Jones outperformed closing 0.64% higher at 38,049. This was the sixth straight record close for the broad-based S&P500. Energy was the leader with consumer discretionary, health and tech lagging. Tesla plunged over 12% as investors took fright over poor guidance with 2024 vehicle volume growth expected to be notably lower than 2023 levels. IBM jumped 11.5% with revenue and EPS beats while noting accelerating client demand for AI. Intel tumbled nearly 10% after hours after guidance missed expectations despite strong Q4 earnings.
Asian futures are mixed. APAC stocks traded mostly positive on the Chinese stimulus speculation. But the upside was capped by rising global yields. The Hang Seng and Shanghai Composite rose as mainland investors took their first opportunity to react to the latest support measures by the authorities.
Gold traded in a narrow range with a bid. Treasury yields bumped into resistance and came off their recent highs. Support remains around $2000 and resistance $2037/39. Continued strength in the US PMI data and so resilience in the US economy is something to watch out for regarding the dollar and rate cut pricing.
Day Ahead – US Core PCE
The Fed’s favoured measure of inflation – the core personal consumer expenditure deflator – came in at 2% y/y for the second quarter in a row. We get the monthly data later today. This is likely to confirm that the monthly increase has come in below the key 0.17% m/m threshold for the sixth month in seven. This is key as many economists believe that’s the run rate we need to hit over 12 months to get us to the Fed’s 2% y/y target.
Yesterday’s Q4 GDP confounded all expectations as it has done over the past several readings. Strong consumer and government spending helped. It all meant the economy grew 2.5% in 2023, confounding many who thought recession was likely. But this does potentially mean Q1 this year could be weaker as consumer momentum is expected to slow. PMI also signalled solidity.
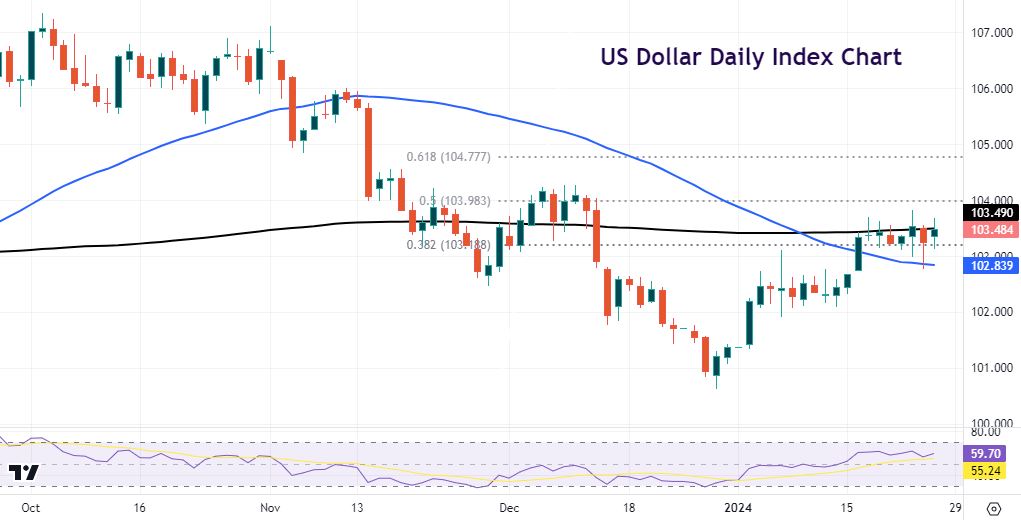
Chart of the Day – US Dollar Index 200-day SMA
The Dollar Index is tracked widely by global market participants. It is the measure of value of the USD versus a basket of six currencies used by US trade partners. The euro has by far the biggest weighting in the index (57.6%) with the next largest being JPY (13.6%) and GBP (11.9%). This means the EUR/USD is a similar chart, but turned upside down.
Prices are still struggling to break higher decisively above the 200-day SMA at 103.49. Support sits at the Fib level (38.2%) of the autumn sell-off at 103.18. The 50-day SMA is at 102.83. The longer prices trade in a narrow range and track sideways, the bigger the breakout will be. The halfway mark of the October downtrend is above at 103.98.